


The Next Five Years of the New Government
Quantum Advisors India
Building your India portfolio since 1990 on a foundation of ethics, integrity & disciplined investment research process.
July 2, 2024India’s new coalition government faces key challenges, including boosting private and foreign investment, supporting small businesses, and increasing consumption and incomes. Achieving sustained 7% GDP growth requires addressing these issues while ensuring economic stability and democratic representation.
India achieved political freedom in 1947. India become a republic in 1950 when it adopted its own constitution. India got its first democratically elected government in 1952. Since then India has seen, 17 sessions of the Lok Sabha (lower house of parliament) of which 12 government’s completed their full 5 year term. The first governments till 1971 and the last 5 governments since 1999, have been full term governments. Also, if at all there has been a change in the Prime Minister (PM) in this period, it has been due to the death of a serving PM. 1
Barring the political flux with changing governments and unstable coalitions between 1977-1999, India has broadly seen political stability and continuity. This was not what the world expected India to become. In 1947, India was a torn, impoverished and partitioned country, which chose democracy with universal adult franchise as its form of parliamentary governance, and which many expected to become a basket case.
But here we are, 75 years after Independence, not an economic success like some other east Asian economies but not a basket case either like some South American countries.
A lot of that is due to India’s secular commitment to democracy. A lot of it is due to India, Indians and Indian businesses, getting economic freedom only in the 1980s. Until then India was ‘trysting’ its fate with planned economic development and a socialist/nationalistic state with control over resources. It was in the 1980s, that the Indian government stopped being antagonistic to the private sector. This was followed by the landmark reforms of 1991.
Since then, all governments in power, have followed a blue-print of reforms to:
- move towards a market driven economy – where demand / supply, competition, and prices determine actions as compared to state control;
- liberalise, de-regulate, dis-invest/privatise segments of markets/sectors/companies; and
- create and enable rule of law through institutions and regulators – in financial markets with RBI and SEBI; through judiciary and courts; through regulations like bankruptcy code, real estate regulation and regulators like competition commission, telecom authority, energy, etc..
Many millions have come out of poverty in the last 40 years. Many millions have benefitted from the benefits of a slowly open market economy. Millions of investors have benefitted from being share holders in private enterprises with ever rising values. The government has also benefitted with ever increasing taxes, resources and state capacity.
Thus, it has not mattered whether we have a government from the right or the left; a single party or a coalition; stable or unstable. All government’s have followed on this blue print.
Chart 1: Election results have not mattered to long-term GDP growth
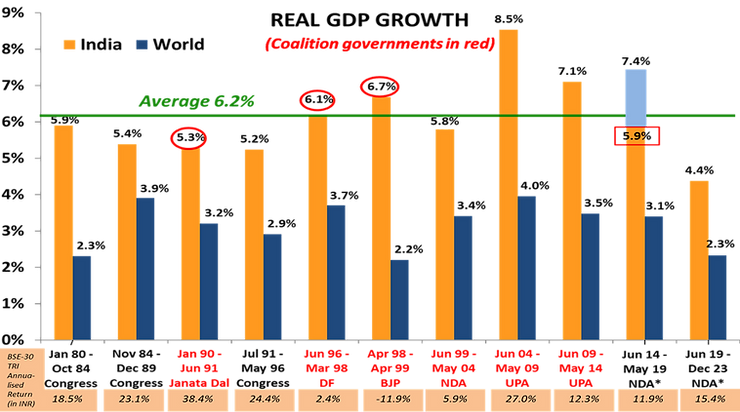
(Source: Worldbank, RBI and www.parliamentofindia.nic.in as of December 2023. Note: The number in red rectangle is from a changed data series starting Jan 2015. While a “superior” series, there is no comparable number to equate the “New” with the “Old”. Most economists deduct 0% to 1.5% from the “New” to equate to the “Old”; World bank data is annual estimate)
India’s 18th general election threw up a surprise – sort of. For, the next five years Prime Minister Narendra Modi must now rule under a coalition with support from its allies – a new situation for Modi who never had to depend on any coalition partner either as Chief Minister of the state of Gujarat for 13 years or as Prime Minister for the past 10 years.
Coalition government were the norm in India’s recent history as the chart above shows. Since 1980, India has had 11 governments, and only 5 of them were, or were run like, a single-party government. A point missed by many is that, under single party governments, GDP growth tended to be lower than the 44-year average of 6.2% rate of annual growth. The growth trajectory of India’s economy is likely to continue as Indian corporates have successfully manoeuvred their businesses irrespective of the government in power.
Having strong majority may have some good aspects in decision making, but in a country as diverse as India in terms of regions, religions, castes, languages, dialects .. a coalition of parties is more representative of these factions. Discussion and debates are crucial for a thriving democracy, we are thus enthused by the fact that over the next five years, we will not only have the government dependent on coalition partners but the parliament itself would see a stronger opposition. (see the webinar summary slides linked above where we show pictorially the increase in opposition numbers)
India may also avoid slipping into an autocratic state like China, Russia or Turkey where a strong man rule have proved to be ruinous for the economy and for stock market returns.
(see the webinar video above, from 28:00 minutes, where we display in charts, how India being democratic with rule of law has enabled economy and market returns to have a phenomenal tight link; unlike in some other countries)
Although ~6.5% real GDP growth /11-12% nominal GDP growth 3 is very respectable, it may not be enough to create jobs, meet aspirations and improve income levels of the millions coming into the job market every year.
Japan, South Korea, Taiwan, China – countries which grew in double digits for close to two decades to reach where they are today. We remain sceptical of India’s ability to grow at that pace.
One key reason is the investment rate. India has not been able to invest and grow at a fast and consistent pace. As the chart below shows, barring the period 2003-2012, where private investments soared, we have unable to attract investments from private and foreign investors at scale.
Chart 2: India needs to attract more private and foreign investments to boost economic growth
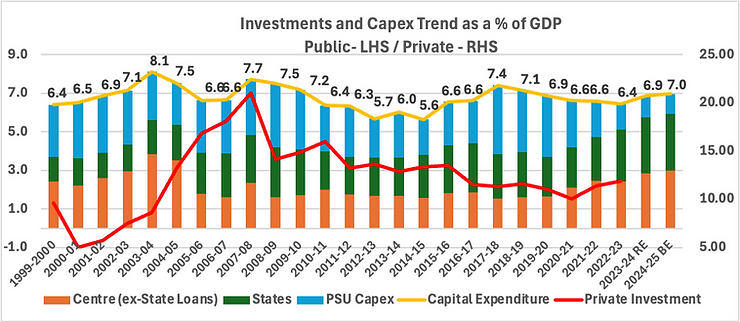
Chart showing public (centre, states, PSU) and private investment as a share of GDP (1999–2025), with public capex stable to rising in recent years while private investment declined after 2008 and is gradually recovering.
(Source: Indiabudget, CMIE Economic Outlook, Worldbank; Annual Data; RE= Revised Estimates; BE = Budget Estimates)
This will be a key challenge and ask from the new government. To provide the confidence to the private sector to invest and at the same time continue to build large public infrastructure.
The other two major asks from the government would be on the focus on small business/informal enterprises and on boosting consumption and incomes.
These may have been part of the reason for the government to have lost a few seats and some potential vote share.
1) Need to revive small and medium enterprises. (formal and informal)
The table below is the sobering reality of some forced formalisations and some disastrous decisions that impacted informal enterprises. Reforms like GST, Real Estate Regulation, are much needed but it has had an impact on informal/small business. Policy decisions like demonetisation (Nov 2016), the response to the credit crisis (sept 2018) and the limited economic support during COVID led to some more forced formalisation.
India has too many small/dwarf firms. Many are informal. However, they are a source of self and other employment. A forced formalisation must mean that many households who run/work at these informal firms have seen lower incomes and higher unemployment.
Chart 3: A sobering reality of India’s informal businesses
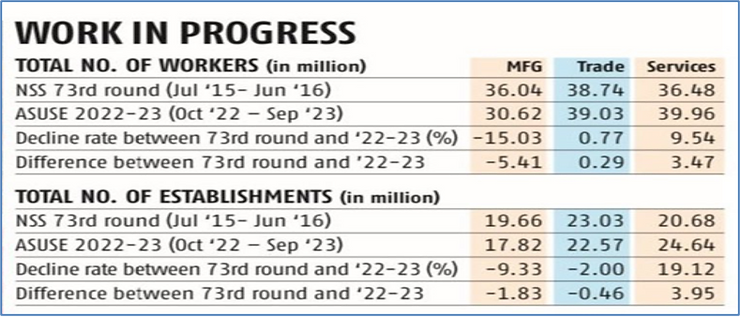
Table comparing workers and establishments across manufacturing, trade, and services (2015–16 vs 2022–23), showing declines in manufacturing and growth in services, with mixed trends in trade.
(Source: Business Standard article, 23rd June, NSS- National Sample Survey, ASUSE – Annual Survey of Unincorporated Sector Enterprises
A 15% drop in informal manufacturing workforce and a 10% drop in informal manufacturing establishments is concerning. It has impact on incomes, investment and consumption.
A similar trend seems to have played out in the formalised small enterprises as well. They have seen job losses and shut downs. The government need to reverse this trend by offering policy support to these enterprises.
2) Consumption and Income Support
Chart 4: India’s Growth recovery has been uneven
| Indicator | FY24/FY20 | FY20/FY16 |
|---|---|---|
| GDP (at Constant prices) | 19.6% | 27.8% |
| Private Consumption Expenditure (PFCE) | 17.5% | 29.4% |
| Government Consumption Expenditure (GFCE) | 10.8% | 31.7% |
| Gross Capital Formation (GCF) | 29.5% | 24.2% |
Cumulative GDP Growth from Pre‑Pandemic Levels
Higher investment growth over consumption is in general good for a country like India which needs investments to boost its supply side economy. However, the challenges as highlighted above in terms of lost informal employment and its impact on incomes and businesses.
Also, the dynamics in the job market as shown in the table below. Between March 2016 and March 2020, as per CMIE data, there was no increase in total persons employed.
Even pre covid, given the stress in the manufacturing and construction sector (formal and informal), people lost out on salaried and casual labour jobs and moved back to farming and or became self-occupied.
We may romanticise, self employed or business (as start ups etc) but these are pre-dominantly very low paying, low productive, just about self sustaining activities in rural and urban India.
Chart 5 – India has added workers into farming and low grade self employment
| In million | Employed | Self-Occupied / Business | Salaried employees | Small traders & wage labourers | Farmers |
|---|---|---|---|---|---|
| Mar-16 | 403 | 13.2% | 22.8% | 41.2% | 22.6% |
| Mar-20 | 406 | 20.1% | 21.4% | 30.5% | 28.0% |
| Mar-24 | 432 | 20.9% | 21.9% | 29.9% | 27.3% |
(Source: CMIE Economic Outlook – Consumer Pyramid Surveys)
The data in charts 3-5 indicate the story that has played out. Lost or lower incomes due to loss of salaried/labour/enterprise jobs. Most have shifted to low paying farming or self employment. This has resulted in lower incomes and hence lower consumption growth.
There is a silver lining, which is visible in the last row of chart 5. Over the last 4 years, employment has gone up. The salaried jobs has seen an increase and farm jobs have seen a decline in overall share.
This is a good trend and some support by the government in the upcoming budget towards boosting small business and improving incomes of the poor and marginalised in rural and urban India will go a long way in boosting India’s near term GDP growth trajectory towards a sustained 7% level.
As we show in the webinar video and in the summary slides above, India is indeed on the cusp of a sustained revival in its economic trajectory.
See the webinar video from around the 41:00 minute, where we speak about market earnings growth and then list down reasons as to why we think GDP growth is likely to improve.
In summary, Indian banks and private corporates have pristine balance sheets which should be able to fund the oncoming private capex cycle.
Indian households have also entered into a residential real estate cycle. We are seeing new houses being constructed/ bought across Tier 1/2/3 towns. This tends to be a big economic multiplier as also creator of casual labour/construction jobs which pulls workers away from farming.
India’s consumer sentiment indices are finally above its pre-covid levels. Given the increase in employment levels and recovery in the household balance sheet, we expect to see change in demand conditions.
If the government indeed focusses its budget a bit more towards social and rural spends, we would get more confident of the sustainability of the underlying recovery.
Chart 6: Welfare and Infrastructure : It cannot be ‘either/or’
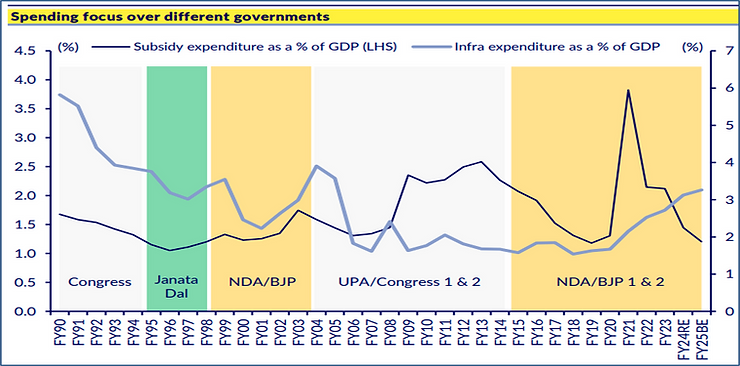
Line chart comparing subsidy and infrastructure spending as a share of GDP across governments, showing subsidies declining over time while infrastructure spending rises in recent years, especially under NDA/BJP.
(Source: CLSA Research, April 2024 report)
In our previous two insights;
- Hype, Hope and Reality: we looked at the major investing aspects of Democracy, Demography and Development – to get investors to have realistic expectations and be aware and not get swayed by Hype and Hope
- Time for Reality Check: We noted the good progress made by the government but cautioned on four aspects of 1) Falling FDI despite positive sentiment; 2) lack of good exports growth despite China+1; 3) lack of income/consumption growth and 4) need for more investments
Investors need to be aware that India needs more investments to boost its supply side; and also needs more welfare to support its poor and needs more equitable outcomes to ensure that the fruits of growth and development is as broad based as it can be.
We continue to believe that India’s long term real GDP growth potential is 6.0%-6.5%. This leads to an annual nominal GDP growth of around 11%-12%. That nominal growth plus corporate productivity is what is reflected in the Indian equity markets and its indices.
This double digit nominal returns is the long-term equity return assumption case for the last three decades and will remain possible for the coming two decades. (*)
Chart 7: Across many years of political and economic mood swings, India has delivered double digit returns(*) – Q India Value Equity Composite (QIVEC)
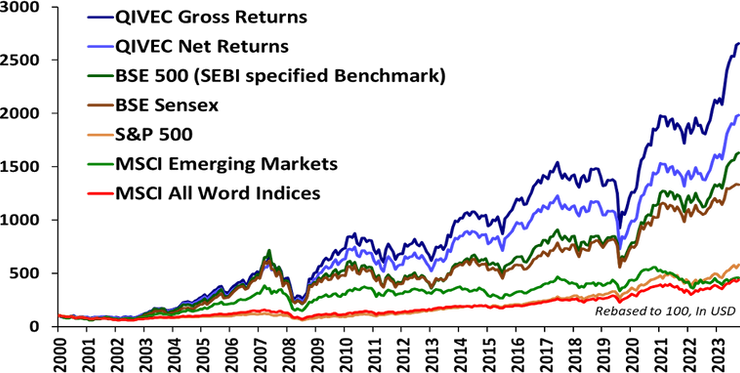
Multi-line chart (2000–2023) comparing QIVEC returns with global indices, showing QIVEC significantly outperforming benchmarks like BSE, S&P 500, MSCI EM, and MSCI World since Inception of the strategy.
Source: Quantum Advisors, Bloomberg Finance L.P.; As of May 31, 2024
(*) – See annexure table below for returns of Indian indices in USD. For all periods – 5,7,10 years and since inception of Q India Value Equity Composite (July 2000), the BSE-500 Index returns in USD terms have been in double digits.
Data of other indices is provided for information purpose only and to allow investors to compare the performance of the account to that of certain indices. – Past performance does not guarantee and is not indicative of future results. Please refer to disclosures and disclaimers and Annexures as given below.
Source Footnotes
1 Wikipedia – India election history
2 Wikipedia – Narendra Modi
3 St Louis Fred Graph
Annexure – 1
Performance of the Q India Value Equity Strategy (Composite) computed as per methodology prescribed under SEBI
(% change in INR)
(Annualized)
| % change in IN | 10 Years (Annualized) |
7 Years (Annualized) |
5 Years (Annualized) |
3 Years (Annualized) |
1 Year | 6 Months | 3 Months | 1 Month | |
|---|---|---|---|---|---|---|---|---|---|
| QIVEC (Net returns) | 16.1% | 13.6% | 12.9% | 15.2% | 16.5% | 36.5% | 18.3% | 5.0% | 0.6% |
| Benchmark – BSE 500 TRI* | 14.8% | 15.2% | 15.6% | 18.0% | 18.1% | 34.7% | 17.7% | 5.2% | 0.8% |
(% change in USD)
| % change in IN | Since Inception (Annualized) |
10 Years (Annualized) |
7 Years (Annualized) |
5 Years (Annualized) |
3 Years (Annualized) |
1 Year | 6 Months | 3 Months | 1 Month |
|---|---|---|---|---|---|---|---|---|---|
| QIVEC (Net returns) | 13.1% | 9.7% | 8.8% | 11.1% | 11.2% | 35.3% | 18.2% | 4.3% | 0.6% |
| Benchmark – BSE 500 TRI* | 11.8% | 11.3% | 11.4% | 13.9% | 12.7% | 33.5% | 17.6% | 4.5% | 0.8% |
Inception Date: June 27, 2000; data as of May 31,2024
* Effective April 1, 2023, the benchmark for Composite has been changed to S&P BSE 500
Disclosure Statements:
- Composite inception date is taken as the date on which the Portfolio Account is funded by the Client and accrual of Management fees commences.
- All INR to USD conversion has been done based on RBI FX Rates till May 2010, and WM Reuters Closing Spot Rates (4pm UK time) from June 2010 onwards.
- The performance shown above does not guarantee future results and future performance may be lower or higher than the data quoted.
- Recipients may check the relative performance of investment approach offered by other Portfolio Managers under the same strategy by clicking APMI PMS performance data
Brief note on performance computation methodology under SEBI guidelines:
SEBI has prescribed specific guidelines on computation and disclosure of performance by portfolio managers to their clients and in marketing materials. A summary of these guidelines is given as below.
- The performance of a discretionary portfolio management mandate shall be calculated using Time Weighted Rate of Return (“TWRR”) method.
- Cash holdings and investments in cash equivalent are considered for calculation of performance.
- Performance computed and reported shall be net of all fees and all expenses (including taxes/statutory levies thereon).
Statutory Disclosures:
- The performance reported above is not verified by SEBI.
- Quantum Advisors provides a direct on-boarding option to clients who wish to avail our services, without intermediation of persons engaged in distribution services.
- For detailed description of Q India Value Equity Strategy such as investment objective, assets allocation pattern, investment strategy and philosophy, associated risk factors and other details please refer to the Disclosure Document available at www.qasl.com.
Important Disclosures & Disclaimers
Any information contained in this material shall not be deemed to constitute an advice or an offer to sell/purchase or as an invitation or solicitation to invest in any security and further Quantum Advisors Private Limited and its employees/directors shall not be liable for any direct or indirect loss, damage, liability whatsoever arising from the use of this information.
Recipients should exercise due care and caution and if necessary, obtain the professional advice prior to taking any decision based on this information. Disclosures and Risk Factors PDF read all important disclosures and disclaimers.
Important Notice:
This newsletter contains hyperlinks to websites operated by third parties. These linked websites are not under the control of QAPL and are provided for your convenience only. Clicking on those links or enabling those connections may allow third parties to collect or share data about you. When you click on these links, we encourage you to read the privacy notice of the website you visit. QAPL does not endorse or guarantee products, services or advice offered by these websites.
UK related important disclosures:
- The content of this newsletter has not been approved by an authorised person within the meaning of the Financial Services and Markets Act 2000 (“FSMA 2000”). Reliance on this newsletter for the purpose of engaging in any investment activity may expose you to a significant risk of losing all of the property or other assets you invest or of incurring additional liability. This newsletter is exempt from section 21 FSMA 2000 on the grounds that it is directed only to certified sophisticated investors, high net worth companies, unincorporated associations, trusts and/or investment professionals within the meaning of the Financial Services and Markets Act 2000 (Financial Promotion) Order 2005 (“FPO”). The investment activity described in this newsletter is only available to these persons or entities and no other person or entity should rely on the contents of this document.
- The protections conferred by or under the Financial Services and Markets Act (FSMA) will not apply to this newsletter and any investment activity that may be engaged in as a result of this newsletter.
The applicability of any dispute resolution scheme or compensation scheme and its jurisdiction (if and where applicable) pertaining to a transaction resulting from this newsletter would be as specified in the respective client agreements.
Related Post
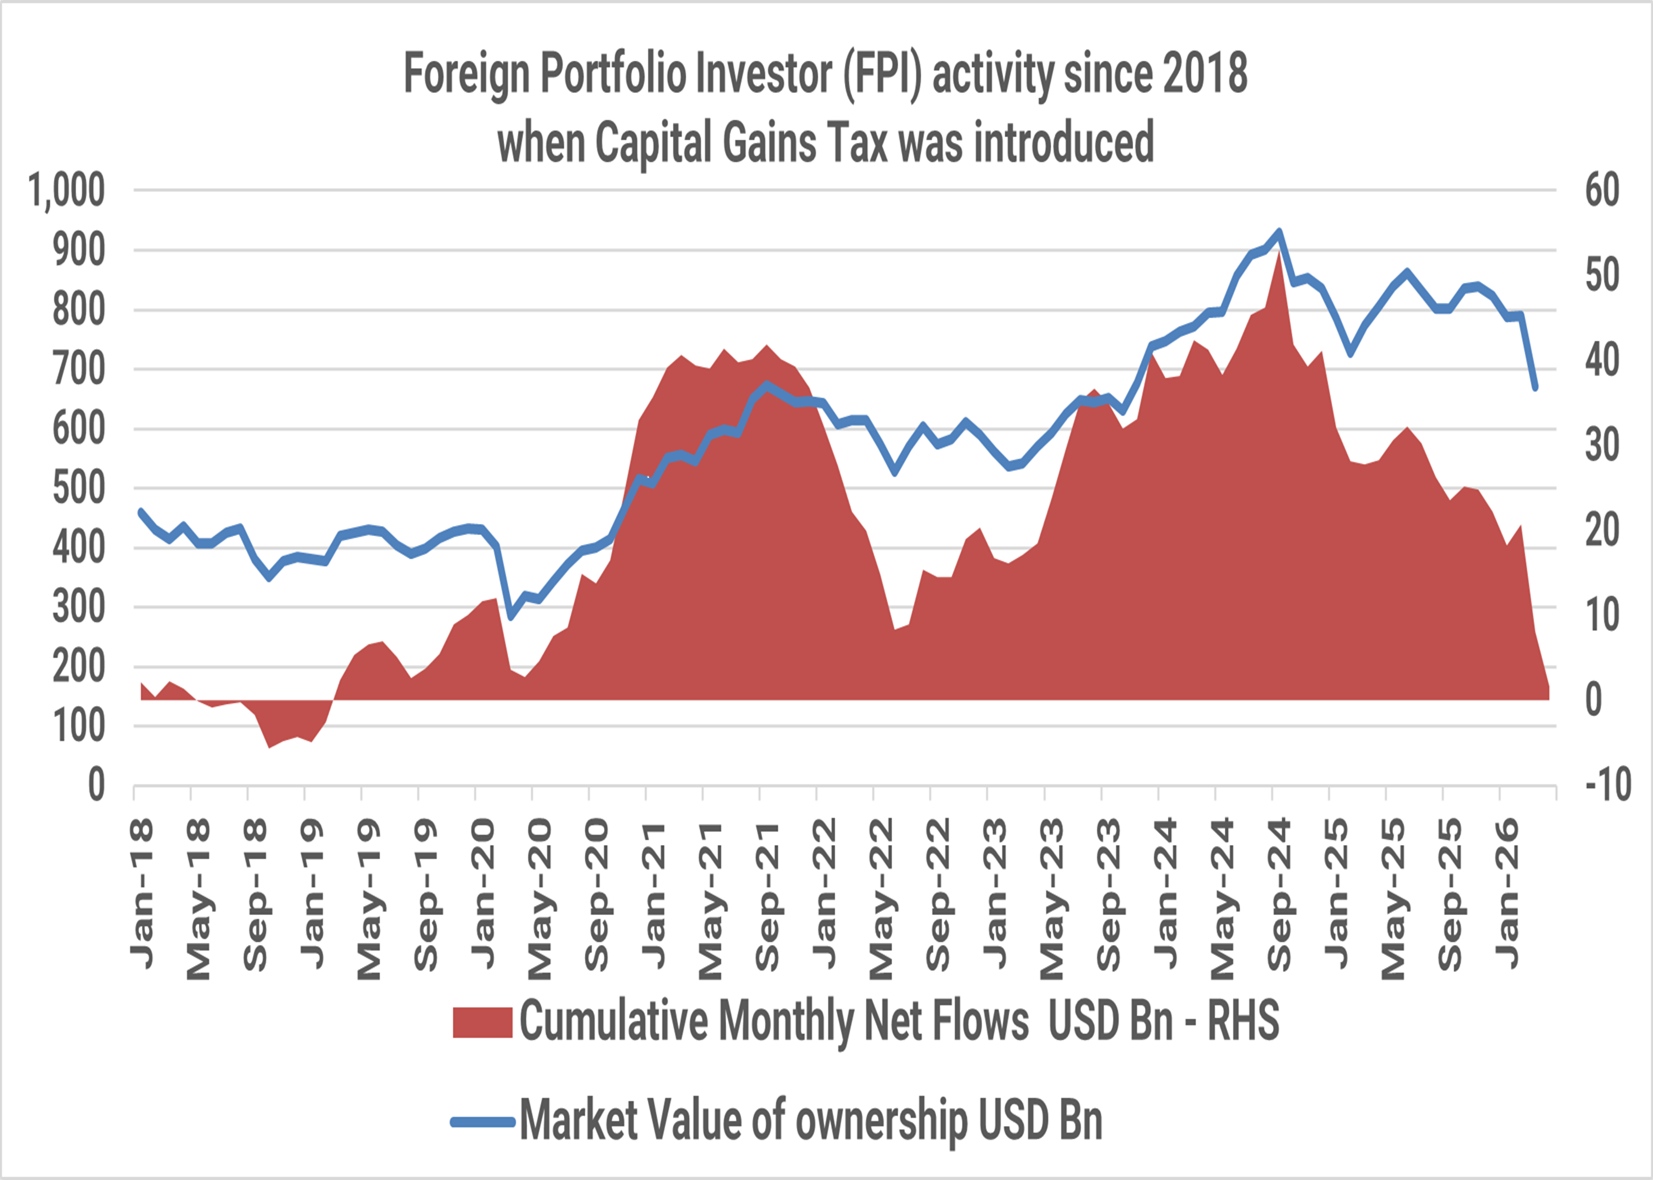
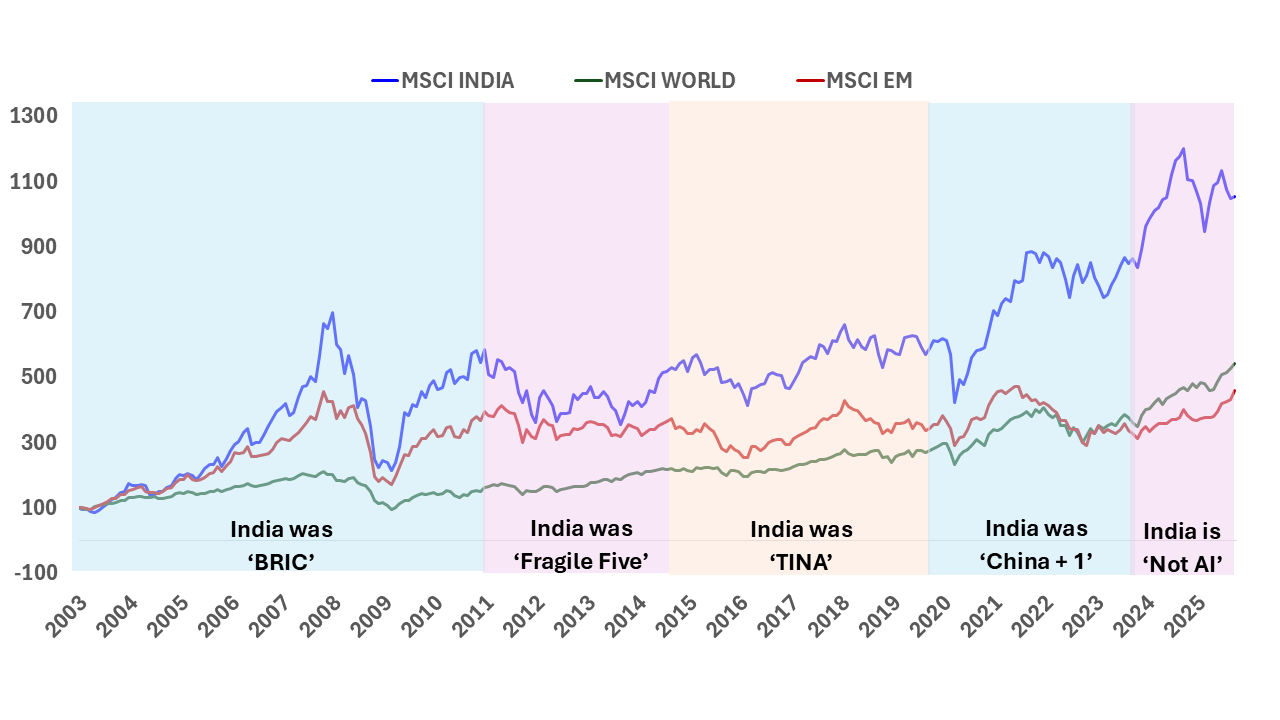
India: T I N A to A N T I
The Indian public equity markets peaked in September 2024. Since then, foreign investors have sold USD 51 billion till April 2026. The market value of foreign investor holding in Indian equities has fallen from USD 930 billion in September 2024 to USD 670 billion, a ~30% drop as at the end of March 2026.

India Investing: From a complicated 2025 to a Simpler 2026?
The simple India investing story of double-digit nominal GDP growth reflecting in stock market returns even in dollar terms has faced some headwinds in 2024/2025. Are these headwinds structural? What should investors expect in 2026?
India Investing Under Global Mood Swings
The narrative around global investing is often built around stories. Investors weave these stories around cycles, themes, and opportunities to justify and support their investment rationale.

The Great India Under-Allocation
The most common response to our reach outs to prospective Global Investors to get them interested in Indian Equities is ‘NO’ response.