


India Deserves a Dedicated Investment Mandate
Quantum Advisors India
Building your India portfolio since 1990 on a foundation of ethics, integrity & disciplined investment research process.
April 8, 2022Global wealth is estimated at over USD 250 trillion. Long term investors like Public Pension Funds and Sovereign Wealth Funds account for over USD 50 trillion in assets. The other large pie is of insurance companies. The largest pool is of course of individuals, high net worth and retail.
Most of the wealth is invested in the home country. However, money chases opportunities and returns. Investors seek higher growth destinations. Many investors look at global GDP weights to plan their asset allocation.
What should be India's share of the global wealth and assets under management? India has a ~3% share of the global GDP calculated on dollar exchange rates. In PPP terms, India's share of global GDP is ~7%. If investment portfolios are duly diversified as per economic opportunity, India should command a 2% weightage in global asset allocation. Foreign investments in India should then have been around ~USD 5 trillion.
As of March 2022, Portfolio flows into Indian Equity, Debt and Hybrid instruments in India and through depository receipts amounted to USD 670 billion. If we include FDI, Private Equity and Venture Capital into Indian Equity, Debt and Hybrid instruments the total investments in market value may go up to ~USD 1.5 trillion. Foreign Investors thus are under-allocated to India when compared to the global opportunity asset pool.
Global Long-term investors are also yet to discover the potential and opportunities in India. We argue in this piece that these investors need to increase their allocation to India and recommend an ideal asset allocation.
Table 1: Global Large Pools of Capital are under-allocated to India
| Global Source of Money (USD Billion) |
Assets USD Billion |
Total Portfolio Investments in India |
India’s Share of Total |
|---|---|---|---|
| Sovereign Wealth Funds | 8,000 | 105.5 | 1.15% |
| Global Pension Funds | 53,000 | 54.2 | 0.10% |
| Endowments and Foundations | 1,000 | 3.4 | 0.34% |
| Insurance Companies | 33,000 | 9.3 | 0.03% |
| Corporate, High Net‑Worth and Mass‑Affluent | 170,000 | 498.2 | 0.29% |
| Total | 268,000 | 670 | 0.25% |
(Source: PWC Global Wealth study, Towers Watson, Credit Suisse wealth report, OECD, Quantum estimates, As at March 2022)
Table 2: Global Pension Funds are grossly under-invested in Indian capital markets.
| Investor Category / USD Billion | Equity | Debt(*) | Hybrid | Total | India Investment as a % of their total AuM |
|---|---|---|---|---|---|
| Central Banks / Sovereign Wealth Funds / Governments | 91.8 | 12.1 | 1.6 | 105.5 | 1.32% |
| Pension Funds | 51.0 | 2.9 | 0.3 | 54.2 | 0.10% |
| Endowments / Foundations | 3.4 | 0.0 | 0.0 | 3.4 | 0.34% |
| Insurance | 8.9 | 0.4 | 0.0 | 9.3 | 0.03% |
| Investment Advisors / Asset Managers / Funds and others | 462.0 | 33.7 | 2.5 | 498.2 | 0.29% |
| Total (USD Billion) | 617.2 | 49.1 | 4.4 | 670.7 | 0.25% |
Source: Foreign Portfolio Investments in India; NSDL, (*) Debt includes VRR allotments not invested, data till March 2022, INR/USD =76)
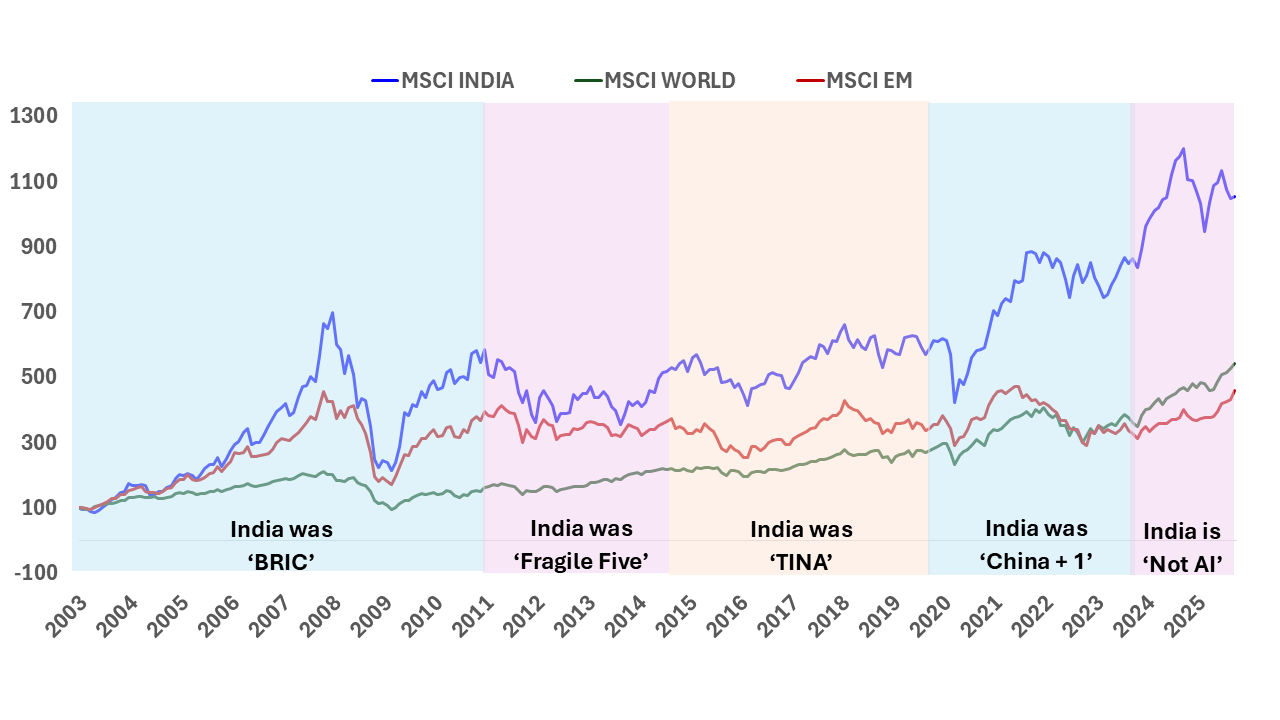
The under-allocation over the years has meant that investors have missed out on Indian equities outperformance
Chart 1: Global Allocators continue to miss India's outperformance
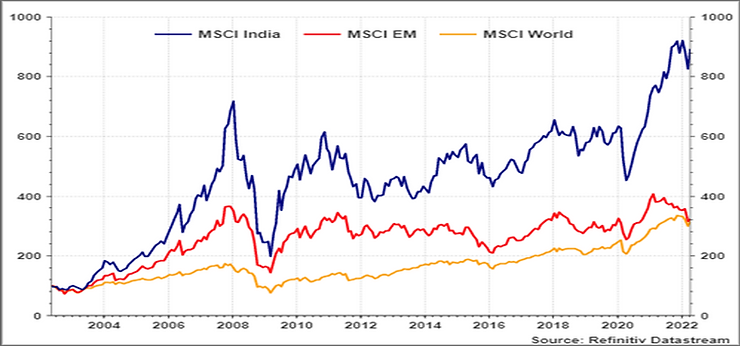
Source: 20 year Data from September April 2002 to April 2022, All MSCI Indices, Rebased to 100 ;, all data in USD
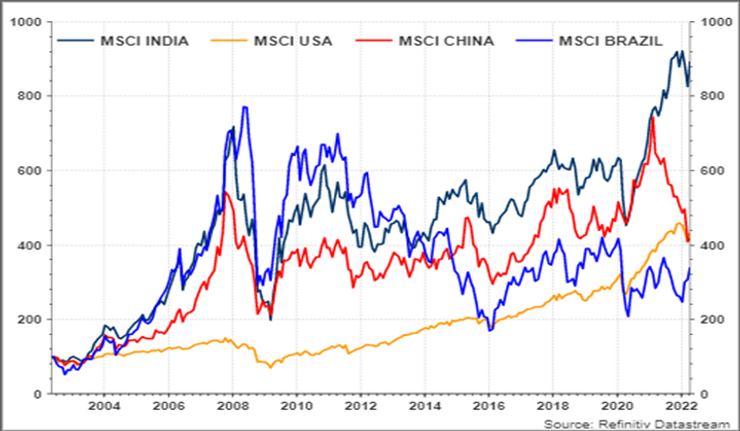
Chart 2 and 3: Rather than a 'BRIC' or 'EM' mandate, consider a dedicated India mandate
Source
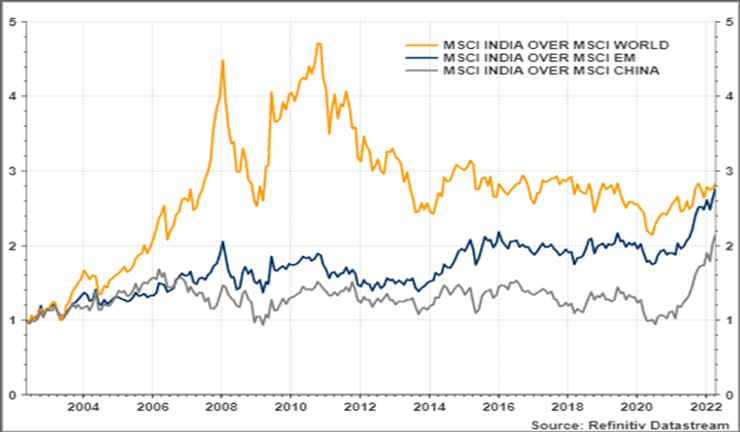
Source: 20 year Data from September April 2002 to April 2022, All MSCI Indices, Rebased to 100 in; all data in USD
Investors do indeed follow growth potential as witnessed in the increase in direct and portfolio flows into China. Many global investors built up a dedicated mandate to invest in China. Over the last 15 years, as China opened up its capital markets, foreign money has gushed into equities and recently into bonds.
Chart 4: Unlike China, India's growth potential is reflected in market returns
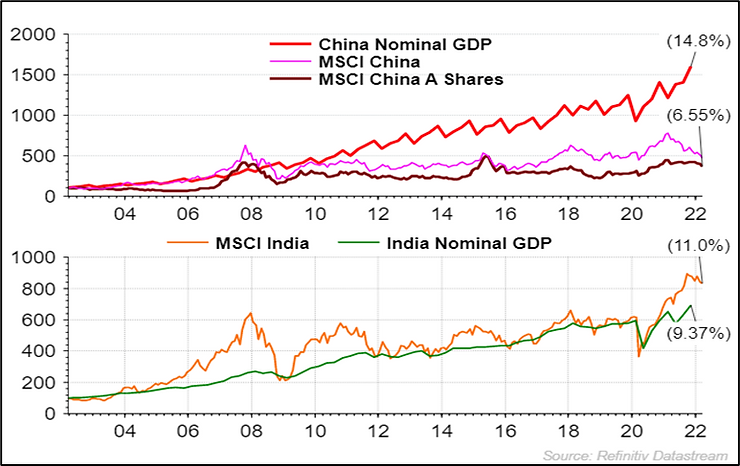
Source: Refinitiv DataStream, Data in USD, rebased to 100, 20 years ago, Quarterly Data, GDP till December 2021 and Markets Data
Chart 6:India's 3 decades of continued reform will make India the next China
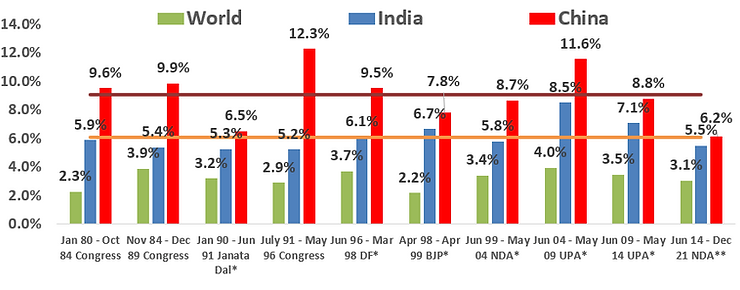
India's GDP is ~USD 2.7 trillion. The per-capita income though remains around the USD 2,000 level. We remain confident of India being able to grow above the 6% real GDP level. As that happens, per-capita incomes increase boosting savings and consumption. The investment opportunity for a global long-term investor thus gets larger.
India will become the fourth largest economy by 2025 and its share in global GDP will continue to rise.
- India's demographics of a younger population would mean a rising working age population for another two decades - unlike China
- Growth pulls millions out of poverty and drives income and consumption higher - just like in China
- Infrastructure investments will boost employment - just like in China
- India's recent reforms in Financial sector and Technology has the potential to leapfrog growth as start-ups mushroom - just like in China
- India's future growth can be sustainable and has the potential to lead from the front - with investments from western investors
| Indian Equity Market Return Assumptions and Expectations | Annual Return |
|---|---|
| GDP Growth, real | +6.5% |
| + Inflation | +5.0% |
| = GDP Growth, nominal | +11.5% |
| If GDP Growth = Revenue Growth (Revenues of Typical Companies) | +11.5% |
| Profit Growth of Typical Companies | +11.5% |
| Companies, listed and in an Index > Typical Company | +13.5% |
| Returns of an Intelligent Portfolio | +15.0% |
| Returns to a Foreign Investor (INR/USD) | +15.0% (+/‑2%) |
Source: RBI, CMIE, Quantum Estimates
India growth potential transcends into corporates earnings and stock market returns. The more than 4,000 listed companies in India's stock markets are representative of the underlying economy. A robust capital markets, both in equity and debt, well governed and open to foreign participation. Domestic investor participation has been increasing with the growth in size of mutual funds and insurance companies.
Table 4: India has the size, growth and the long-term returns.
| % YoY Returns in USD (Monthly data) |
15 Year average of YoY Returns |
10 Year average of YoY Returns |
5 Year average of YoY Returns |
|---|---|---|---|
| BSE Sensex | 12.8% | 11.2% | 15.8% |
| MSCI India | 12.2% | 10.0% | 14.7% |
| India Bond Index | 4.6% | 4.3% | 5.5% |
(Source: Total Returns Index, % YoY returns on monthly data, averaged for the time period, period ending 30-April-2022)
Driven by the returns and as India becomes more mainstream in investment portfolios, India can attract significant flows. Even If global investors allocate 2% of their overall portfolio to India over time across Equity, Fixed Income, Real Estate and Infrastructure, India should receive inflows in excess of over USD 3 trillion.
Table 5: Prepare to allocate more to India in the coming years based on its GDP potential
| India’s share of | Current Weight | Long Term Weight Estimate |
|---|---|---|
| Global GDP | ~2.7% | ~5.0% |
| Global Equity Index | ~1.2% | ~5.0% |
| Global Bond Index | Not Included | ~2.0% |
(Source: Quantum Estimates, Equity Index = MSCI World Index; India is not included in global bond index, but is expected to have a weight of between 0.5%-1.0% if included; In the MSCI EM Equity index, India has a weight of ~9.25% and is expected to have a 10% weight of an EM bond Index on an eventual inclusion)
Today, Foreigners about ~20% of the total India stock market by capitalization. Foreigners own less than ~3% of the Indian Bond market. The Indian stock market capitalization is ~+USD 3.0 trillion. The Indian Bond markets are ~+USD 2 trillion.
Indian public markets are thus large and have substantial absorptive capacity. Public markets are also liquid and access is easier and exits have no particular restrictions.
However, as the data in the next chart shows, India has received as much inflows into private equity/venture capital as it has in listed public equities. The data on PE also includes investment flows into Infrastructure and Real Estate. The opportunity size of Private companies, start-ups, real estate and infrastructure is larger.
However, the access, the ease of investing and the potential for exits are difficult. From governance issues of trusting the partner/investee company to regulatory challenges to dealing with the lack of liquidity and exits has plagued the investor community. There have been successes of course, however a similar risk/return profile is on offer in the public markets at better governance, easier regulatory system and higher liquidity and exits.
Chart 6 and 7: India's private markets are absorbing higher inflows than public markets
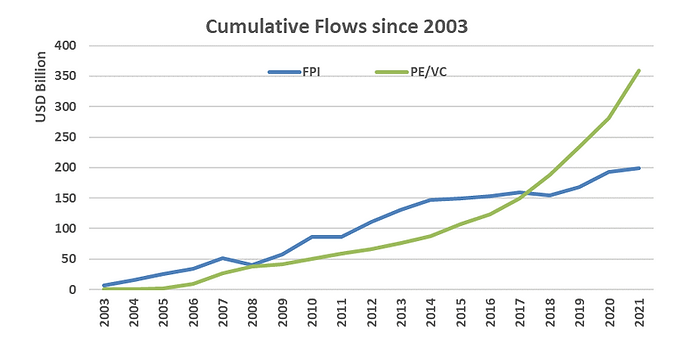
Source
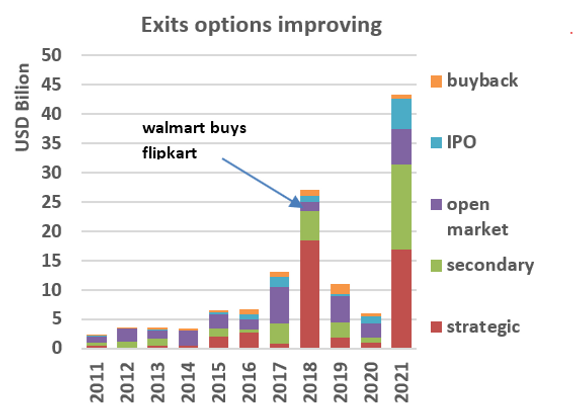
Stacked bar chart showing PE/VC exit options from 2011 to 2021 in USD billions, highlighting strong growth in exits over time with contributions from strategic sales, secondary deals, open market, IPOs, and buybacks, including a spike around 2018 due to the Flipkart acquisition.
(Source: NSDL, EY report on India Private Equity and Venture Capital Industry: some PE investments may have also been counted in FPI)
We have believed that Investors would be benefitted by having a higher allocation to listed, liquid public equities over private equity and sovereign/quasi sovereign bonds over credit. However, as the economy and the markets mature , investor depth improves and the ecosystem develops, we do believe clients who can deal with illiquidity and long-gestation can also look at private asset investing in India.
Chart 8: Opportunities across Asset class: Be Mindful of risks of illiquidity and partner selection
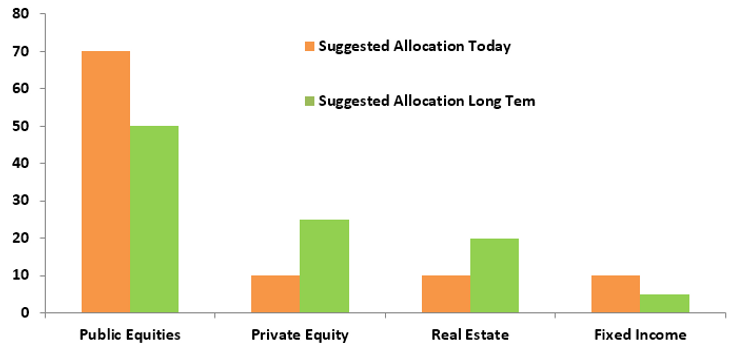
(Source: Quantum Estimates; Allocation as a % of your India Portfolio)
Annexure
Table A: India has the size, growth and the long-term macro-opportunity.
| Indicator | 20 year average |
10 year average |
Last 1 year | Estimate next 5 years |
|---|---|---|---|---|
| Real GDP | 6.9% | 6.7% | -7.2% | 6.0%–7.0% |
| Nominal GDP | 11.6% | 12.6% | -4.2% | 11%–13% |
| Fiscal Deficit / GDP | 7.3% | 6.9% | 6.1% | 6.5%–7.0% |
| CAD / GDP | -1.3% | -1.9% | 0.9% | < (-)2% |
| CPI Inflation | 6.0% | 5.4% | 6.7% | 5.0%–5.5% |
| 10 Year Bond Yield | 7.7% | 7.7% | 6.0% | 7.0%–7.5% |
Source: CMIE, RBI, Quantum Estimates (Data as at December 2020)
Chart A: India will be a large part of the global economy; you cannot ignore it.
For more information and if you wish to discuss the details in the article or if you wish to know more about our investment strategies, the investment philosophy and investment opportunities, please contact:
Arvind Chari - [email protected]
Arvind Chari is the Chief Investment Officer (CIO) at Quantum Advisors. Arvind's vast experience in managing money for global investors and his interactions with leading institutions has exposed him to a world of knowledge. With over 21 years of experience in tracking domestic and global economy he is Quantum's thought leader and is the author of this Q-India Insight edition.
Disclosure Statement
The views are not meant to serve as a professional guide / investment advice / intended to be an offer or solicitation for the purchase or sale of any financial product or instrument for the recipient. Whilst no action has been solicited based upon the information provided herein, due care has been taken to ensure that the facts are accurate and views given are fair and reasonable as on date. Recipient should rely on information/data arising out of their own investigations and advised to seek independent professional advice and arrive at an informed decision before making any investments. This is neither an offer to sell securities of any investment fund nor a solicitation of an offer to buy any securities.
Related Post
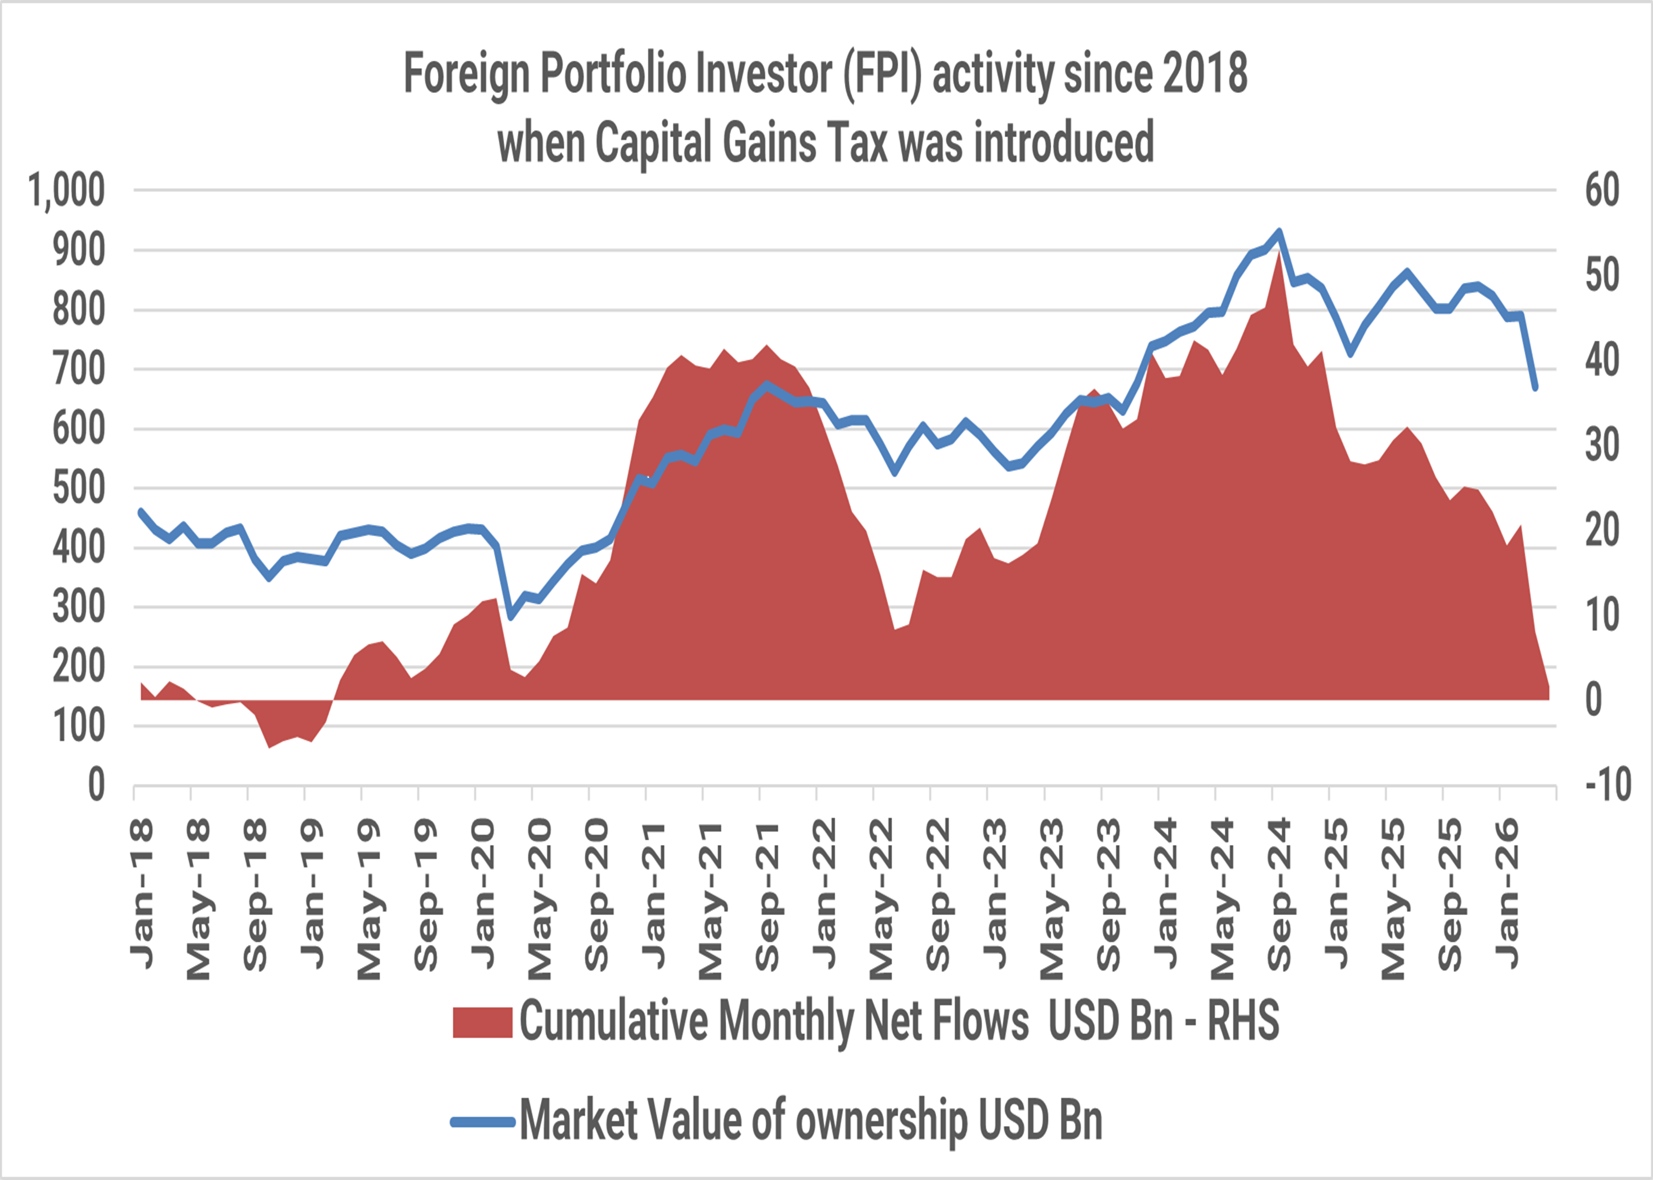
India: T I N A to A N T I
The Indian public equity markets peaked in September 2024. Since then, foreign investors have sold USD 51 billion till April 2026. The market value of foreign investor holding in Indian equities has fallen from USD 930 billion in September 2024 to USD 670 billion, a ~30% drop as at the end of March 2026.

India Investing: From a complicated 2025 to a Simpler 2026?
The simple India investing story of double-digit nominal GDP growth reflecting in stock market returns even in dollar terms has faced some headwinds in 2024/2025. Are these headwinds structural? What should investors expect in 2026?
India Investing Under Global Mood Swings
The narrative around global investing is often built around stories. Investors weave these stories around cycles, themes, and opportunities to justify and support their investment rationale.

The Great India Under-Allocation
The most common response to our reach outs to prospective Global Investors to get them interested in Indian Equities is ‘NO’ response.
Our Strategies
Explore how our two main strategies – Predictable India Equity and India Integrity Equity - with demonstrated success of our tried and tested research and investment processes can ensure your India equity allocation will have higher predictable outcomes and no surprises.
Q India Value Equity Strategy
20+ years of India Long-only, Liquid, High-Governance, Margin of safety = Predictability
Integrity screen since 1996, strategy Track record since 2000.
Q India Responsible Returns Strategy
Liquid, proprietary Integrity Scores, Financial Soundness
Integrity Screen since 1996, enhanced criterion since 2015, strategy Track Record since 2019; strategy AuM: $9.7 mn Mandate Capacity: $5 billion
Quantum Advisors pioneered a quantitative as well as qualitative analytical approach to equity investing in India, providing for the first time, consistently applied valuation metrics to evaluate investment opportunities in India’s emerging stock markets. Over the years, Quantum Advisors has continued and enhanced its tradition of extensive financial analysis and value investing, as it has evolved into an investment advisor and asset manager.
Our investment philosophy and strategy involves the use of intensive qualitative and quantitative fundamental analysis. We build and monitor our clients’ portfolios actively while at the same time avoiding excessive trading, and control risk by endeavoring to keep our clients’ portfolio adequately diversified, both in terms of the sectors included in those portfolios, as well as with respect to the level of concentration in any specific security.