Over the next decade, India is slated to overtake Germany and Japan to become the third largest economy in nominal terms. It is already the third largest in PPP (Purchasing Power Parity) terms. Of course, on an annual per-capita income basis, India at ~USD 2,600 is well below most Asian countries and a few African economies.
As per IMF’s recent estimates for 2022, India’s share of Global GDP in nominal terms will be ~3.35%. This share will rise to well above 5% over the next 10 years.
We do know that economic growth creates opportunities. Opportunities for individuals, businesses, and investors. The outcome though may be varied for different segments.
For instance, in China, many global businesses have benefited by its economic growth. However, most global investors haven’t had such a pleasant experience. Global businesses may derive a large share of their business from China. However, we haven’t seen the same play out in the asset allocation of institutional investors.
Chart 1: India Economic Opportunity is reflected in Stock Market Returns
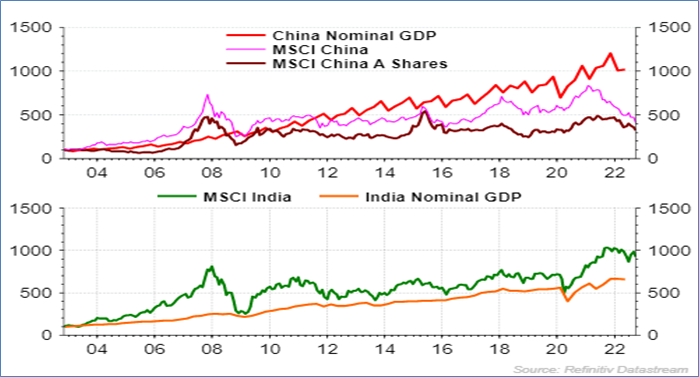
(Source: Refinitiv DataStream, All data in USD, GDP data is quarterly till June 2022, Index data is monthly till September 2022)
A share of global GDP weighted allocation to Chinese public equity markets would have been a disaster. Private market investing was faring better than public markets, however with the regulatory measures taken by the Chinese communist party, even those have unraveled.
The case in India has been different. Investors who have trusted the long-term GDP growth potential and allocated to public equities, have been rewarded with returns commensurate with the economic growth.
In many other global markets, GDP weighted allocation may not be a relevant measure. However, In India it may be one of the most important measure to decide an allocation.
India’s weight in Global GDP will rise above 5% by 2030. It is expected to be ~15% by 2050.
Chart 2: India was a large part of the global economy; India will be a large part of the global economy
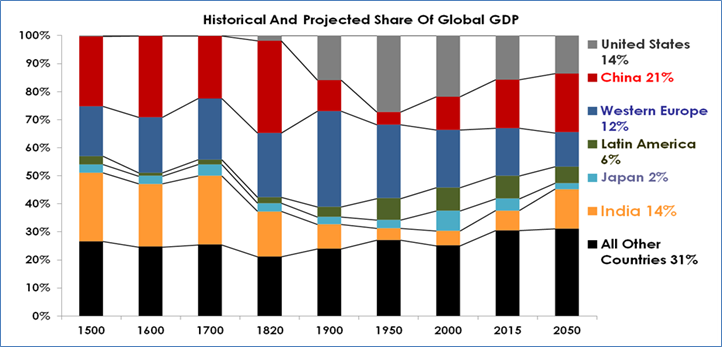
(Source: Quantum Advisors; Angus Maddison, University of Groningen; Madison Project Database)
Are you ready to then allocate as much of your global portfolio to India? Also, the opportunity will present before the potential. Is your investment committee thinking strategically to invest and build up the allocation today, in order to benefit from this growth potential.
Table 1: Foreigners need to invest more than twice their current run rate to take their investable allocation to 5%

(Source: Bloomberg Finance L.P; Quantum Estimates; Global AuM investable outside of the home country is estimated as USD 100 trillion out of a total estimated Global AuM of ~270 trillion ; ) (* - We estimate market value of all foreign investment in India (public equity (USD 600 bn, fixed income (50 bn) and alternative private assets (850 billon) to be USD 1.5 trillion)
The increase in Foreign Investment in market value from USD 1.5 trillion to USD 5.0 trillion seems daunting. However, about USD 2 trillion of the incremental can be accounted for my market appreciation over a 10-year period. That leaves foreigners to deploy USD 1.5 trillion of new capital into India over 10 years. That is USD 150 billion per year. This is more than twice the current run-rate.
Based on the current trend, if 50% of new flows go into private assets like private equity, venture capital, real estate, and infrastructure; 35% in public equities and 15% in fixed income.
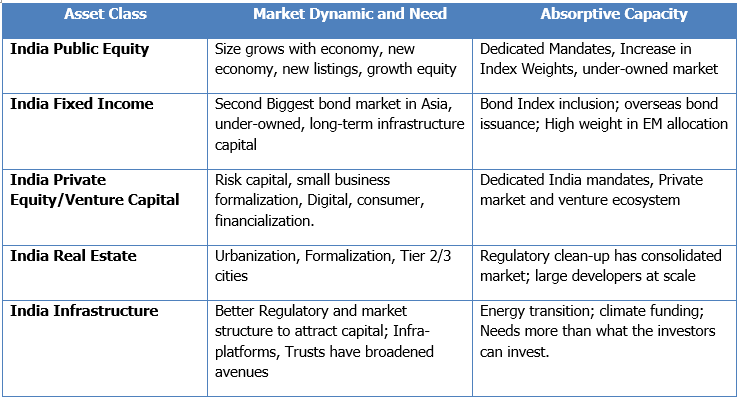
Annual flows of USD 150 billion are large, however, different segments of the economy have gotten larger, seen change in regulations, eco-system has developed and seem well prepared to absorb more flows.
Also, rising economic growth would mean higher incomes and a larger segment of the economy which attains critical size for global business to find it attractive.
Chart 3: India’s broadening income profile will create opportunities across segments
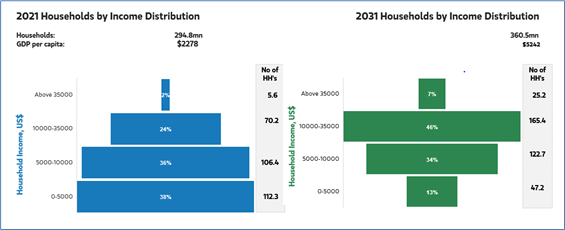
(Source: Morganstanley Research)
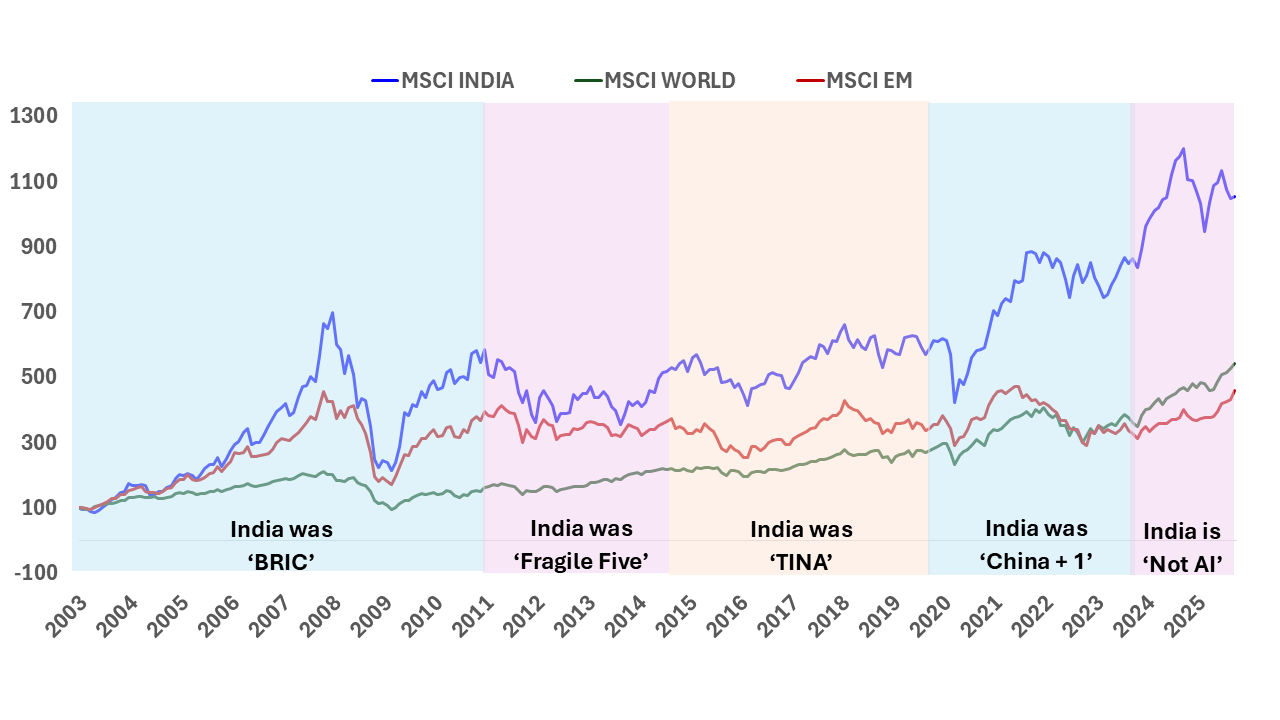
Traditionally, especially in public markets, India has seen allocation as part of Emerging Market, BRIC, Asia-ex Japan, Asia ex China. That has meant that India has remain under-allocated in global asset allocation.
Chart 4: Lazy allocation decisions has led to allocators missing out on India’s public market returns
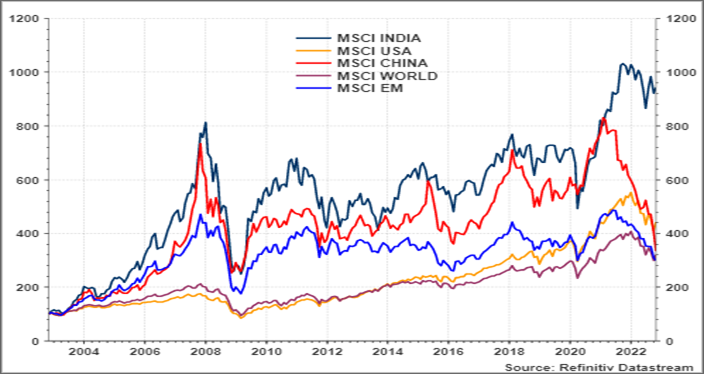
Source: MSCI Indices, Data in USD, 20 year data; rebased to 100 from November 2002 till October 2022
The flows into Indian Private assets, dominated by private equity and venture capital, suggests that India dedicated funds are dominant. We are even seeing global pensions making a conscious decision to choose and invest in Indian Private and Real Asset Markets in a dedicated manner.
Chart 5: Higher allocations to private assets suggests a dedicated approach
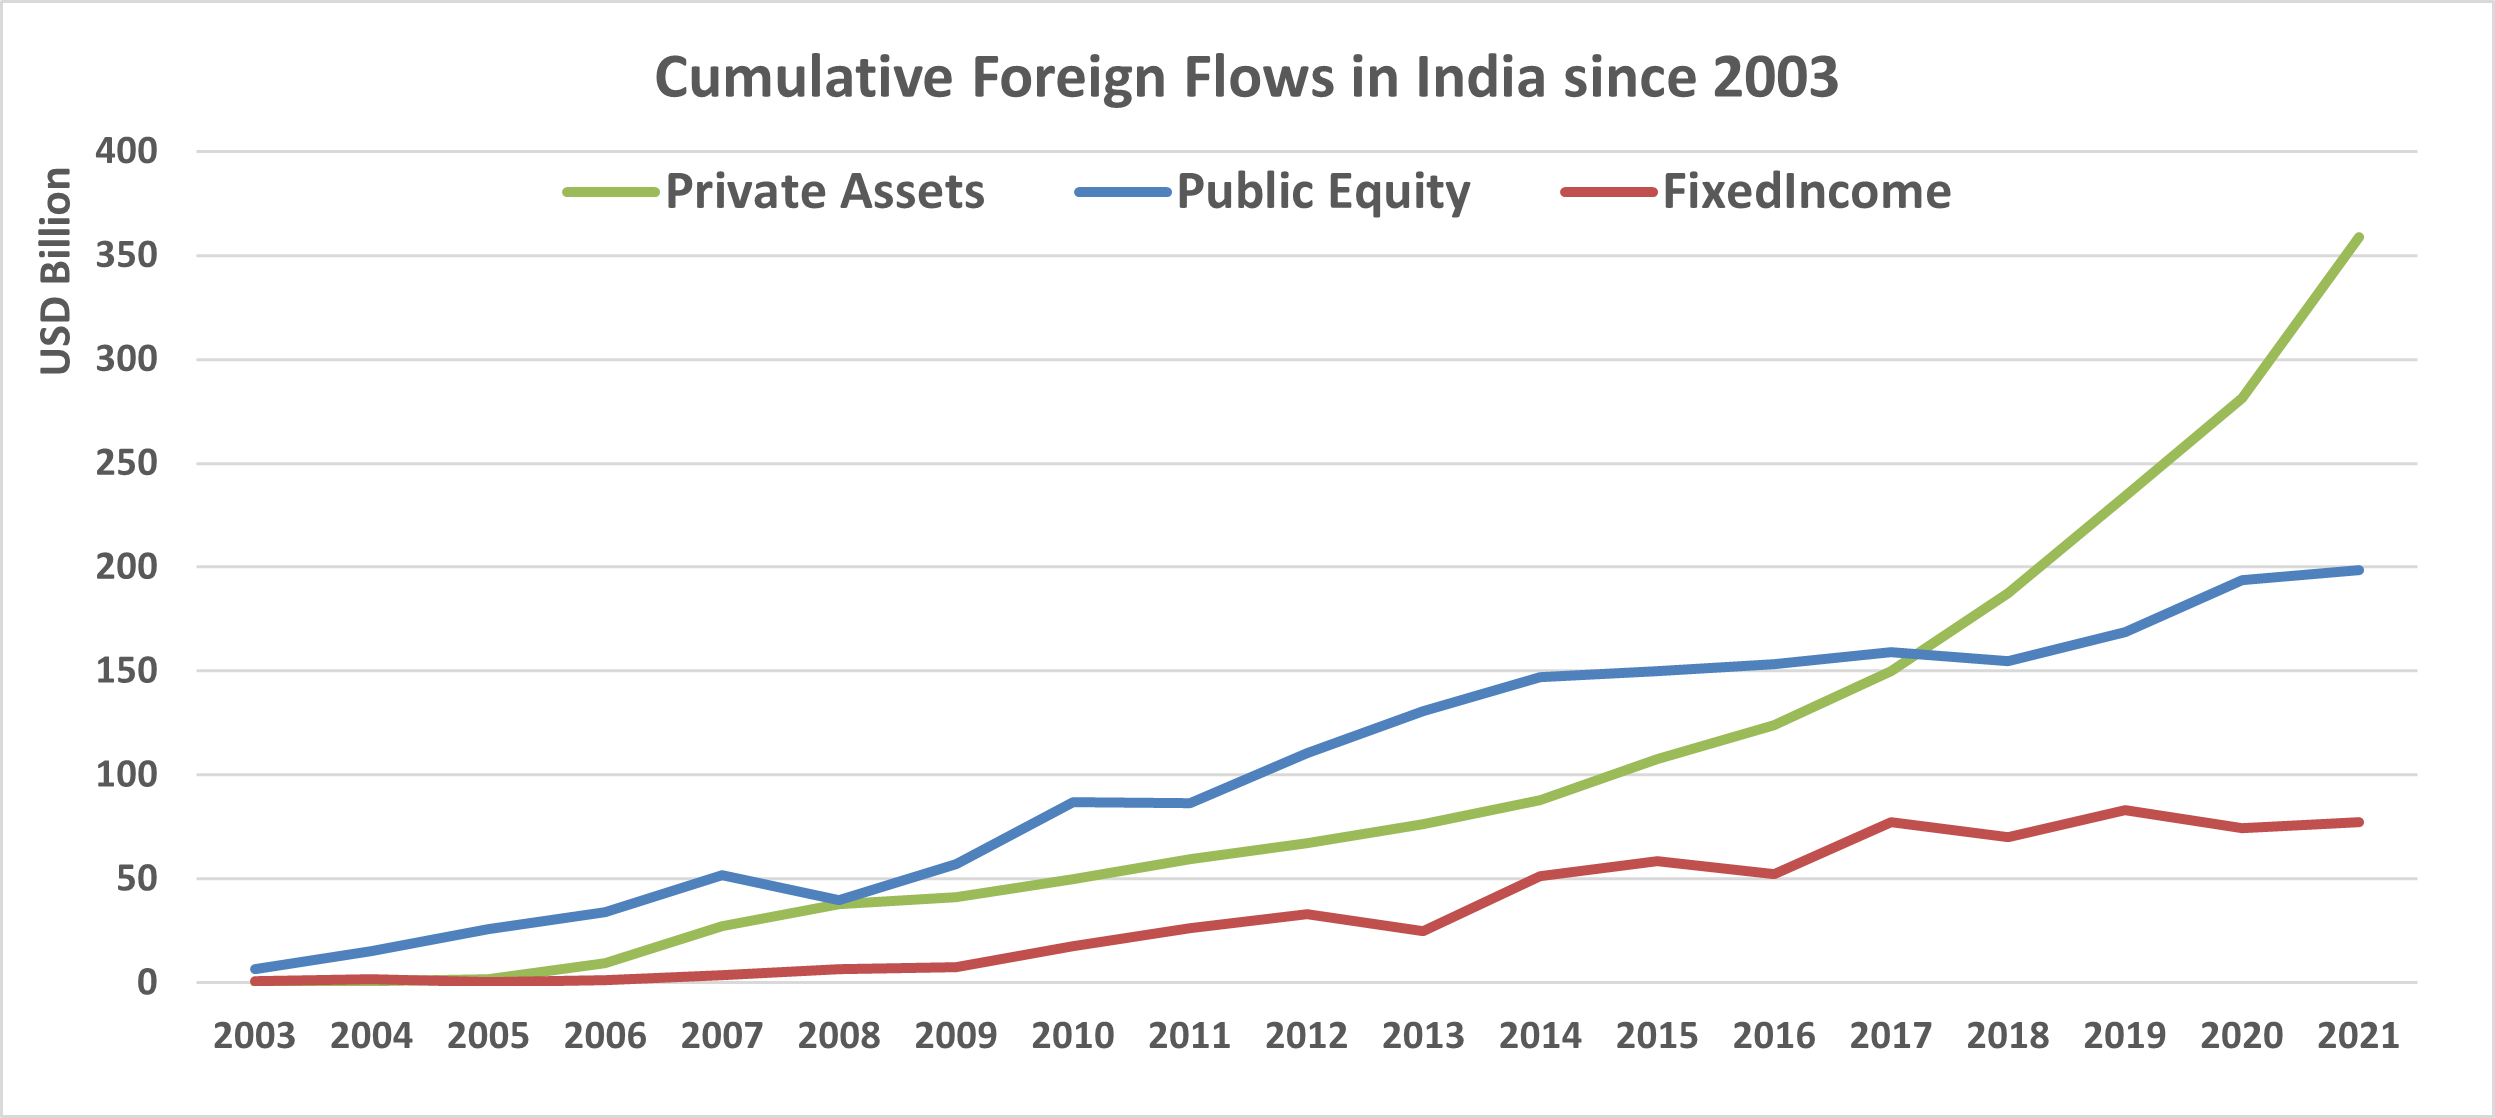
(Source: NSDL, SEBI, IVCA, Annual Data till 2021; Private = Private Equity, venture Capital, Real Estate, and Infrastructure)
We would be encouraged to see this discussion take place in investment committees and boards of institutional investors to think of dedicated allocation to India. As we have shown, a GDP weighted approach is a simple and predictable way of thinking about your long-term India allocation.
For more information about our investment strategies, the investment philosophy and investment opportunities, please contact:
Arvind Chari -[email protected]
Arvind Chari is the Chief Investment Officer (CIO) at Q India (UK), an affiliate of Quantum Advisors India. Arvind’s vast experience in managing money for global investors and his interactions with leading institutions has exposed him to a world of knowledge. With over 18 years of experience in tracking domestic and global economy he is Quantum’s thought leader and is the author of this Q-India Insight edition.

Important Disclosures & Disclaimers:
- Quantum Advisors Private Limited (QAPL) is registered in India and holds a Portfolio Management License from Securities and Exchange Board of India (SEBI), India. It is also registered with the Securities Exchange Commission, USA as an Investment Adviser and a Restricted Portfolio Manager with the Canadian Provinces of British Columbia (BCSC), Ontario (OSC), and Quebec (AMF). It is currently not registered with any other regulator. Registration with above regulators does not imply any level of skill or training
- This summary is subject to a more complete description and does not contain all of the information necessary to make an investment decision, including, but not limited to, the risks, fee and investment strategies of QAPL.
- This article is strictly for information purposes only and should not be considered as an offer to sell, or solicitation of an offer to buy interests in the account. Investments in the equity and fixed income instruments are not guaranteed or insured and are subject to investments risks, including the possible loss of the principal amount invested. The value of the securities and the income from them may fall as well as rise. Past performance does not guarantee future results and future performance may be lower or higher than the data quoted, including the possibility of the loss. Quantum Advisors reserves the right to make the changes and corrections to its opinions expressed in the document at any time, without notice. Information sourced from third parties cannot be guaranteed or was not independently verified. Comments made herein are not necessarily indicative of future or likely performance of the account and are based on information and developments as at 30/09/2022 unless otherwise stated.
- All of the forward-looking statements made in this communication are inherently uncertain and Quantum Advisors (QAPL) cannot assure the reader that the results or developments anticipated by QAPL will be realized or even if realized, will have the expected consequences to or effects on, us or our business prospects, financial condition or results of operations. A prospective investor can generally identify forward-looking statements as statements containing the words “will,” “should”, “can”, “may”, “believe,” “expect,” “anticipate,” “intend,” “contemplate,” “estimate,” “assume”, “target”, “targeted” or other similar expressions. Readers are cautioned not to place undue reliance on these forward-looking statements in making any investment decision. Forward-looking statements made in this communication apply only as of the date of this communication. While we may elect to update forward-looking statements from time to time, we specifically disclaim any obligation to do so, even if internal estimates change, unless otherwise required by applicable Securities law
UK related important disclosures
- The content of this presentation has not been approved by an authorised person within the meaning of the Financial Services and Markets Act 2000 (“FSMA 2000”). Reliance on this presentation for the purpose of engaging in any investment activity may expose you to a significant risk of losing all of the property or other assets you invest or of incurring additional liability. This prsentation is exempt from section 21 FSMA 2000 on the grounds that it is directed only to certified sophisticated investors, high net worth companies, unincorporated associations, trusts and/or investment professionals within the meaning of the Financial Services and Markets Act 2000 (Financial Promotion) Order 2005 (“FPO”). The investment activity described in this presentaton is only available to these persons or entities and no other person or entity should rely on the contents of this document.
- The protections conferred by or under the Financial Services and Markets Act (FSMA) will not apply to this presentation and any investment activity that may be engaged in as a result of this presenation. The applicability of any dispute resolution scheme or compensation scheme and its jurisdiction (if and where applicable) pertaining to a transaction resulting from this presentation would be as specified in the respective client agreements.


