


What is India’s potential GDP growth rate?
The answer to this proverbial question on depends on the period in which the question was asked:
- In the 1980s, the hopeful answer would have been 5%.
- In the 90s, post-liberalization, hopes had risen for a sustainable 6% growth rate.
- During the ‘Goldman Sachs - BRIC’ mania of 2004-2011, it was India’s birthright to grow at 9%.1
- Morgan Stanley’s ‘Fragile Five’ in 2013 smothered it down below 8%.2
- ‘Ache Din’ in 2014 raised hopes of 8% again.3
- In ‘Atma-Nirbharta’4 and ‘Amrit Kaal,’ many seem to be settling for ~6%.5
(* - Ache Din was a slogan used in an ad campaign by Bhartiya Janata Party in 2014; ‘Atma-Nirbharta – economic self reliance’ was used by the government during COVID and ‘Amrit Kaal – an era of elixir’ was first used by PM Narendra Modi in Independence Day speech, 2021 for the next 25 years roadmap)
The political desire to deliver macro stability over growth has meant that faster growth aspirations do not seem to be a priority. This is way too conservative, and the current pace of growth may not be enough to achieve India’s aspirations of becoming a middle-income country and creating meaningful jobs for its youth.
At Quantum, we have long held India’s sustainable real GDP growth rate to be 6.0%-6.5% (6.3% is the average since 1980).
Chart 1: India GDP growth has averaged 6.3% since 1980
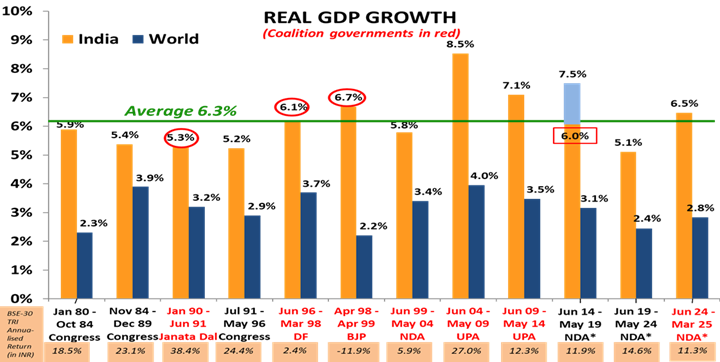
Source:Worldbank, RBI and https://sansad.in/ as of March 2025. Note: The number in red rectangle is from a changed data series starting Jan 2015. While a “superior” series, there is no comparable number to equate the “New” with the “Old”. Most economists deduct 0% to 1.5% from the “New” to equate to the “Old”; therefore, under Modi, the GDP has been at 5.9% at best matching the 5.6% under the BJP-led coalition government of Vajpayee that resulted in a rout for the BJP at the time of the next election in 2004. Please note that data used for World GDP for 2021 is a median Estimate since World Bank data is not yet available and India GDP data is governments second advance estimate released at the end of May 2025. The graph is only for representation and understanding purpose and does not assure any promise or guarantee that the historical performance is indicative of future results.
Our long-term assumption of 6.0%-6.5% real GDP growth comes from a very simple analysis. Assuming India’s Gross Domestic Savings (GDS) of ~30% of GDP and the incremental Capital-Output ratio (ICOR - capital required to get a unit of growth) of ~5, the potential growth (GDS/ICOR) gives us 6%. This ~6% gets balanced by the negative aspects of inefficiency in the government sector and household savings, and the positives of attracting excess foreign savings into India.
India’s ICOR has averaged 4.3 in the last 10 years rolling average6. To get an 8% real rate of growth, if the ICOR increases to 5, the Investments ratio needs to increase to ~40% of GDP. That would mean a combination of higher domestic savings rate of ~35% of GDP and ~5% of GDP in foreign capital flows.
Chart 2: Drivers of Economic Growth – derailed since 2011
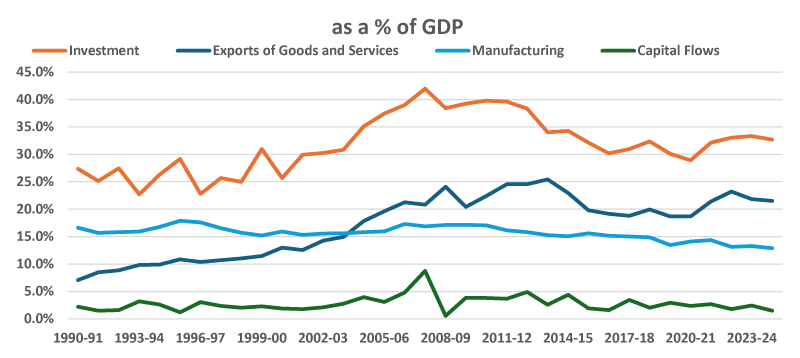
Line chart of India’s macro indicators as a share of GDP (1990–2024), showing investment peaking around 40% before moderating, exports rising to ~25% then easing, manufacturing steady near 15–17%, and volatile capital flows with a spike around 2008.
(Source: CMIE Economic Outlook; Annual GDP at current market prices; Investment=Gross Capital Formation; Total Capital Flows; Data till March-2025)- There is no assurance or guarantee that the historical result is indicative of future results.
For close to two decades from 1991-2011, India’s growth was also in a high trajectory, when investments rose due to an increase in domestic capacity creation, a rise in export share, and an increase in global capital flows.
However, as the chart depicts, the drivers of high economic growth have slowed down and have yet to reach its peak levels of 2011.
Evidently, India industry invested in large capacities in the previous 2002-2012 boom as seen in the rising share of investments/GDP. Some of these leveraged investments got impacted due to various reasons – regulatory uncertainty, corruption, currency weakening and lower commodity prices.
The economy was not supported by exports sector. Goods exports in nominal terms has grown from USD 276 billion to USD 437 billion in the last decade, a mere 4.7% CAGR growth7. It is services growth which is now almost as large as goods trade which provided some support. Given global geopolitical environment and the changed trade policy, India, we believe, seems to have missed out on the export value chain as a growth driver.
Although, we have seen some general increase in Foreign Direct Investment (FDI) flows including some from corporations like Apple for its iphone assembly8, however, as a share of GDP, it remains underwhelming.
The Indian government and the policy ecosystem know what it takes to try and drive growth above potential. Since the 1980s. it was a combination of receding government control, simplification of taxation, freer goods and services trade, and a recognition of treating risk capital in a fair, transparent, and consistent manner which lifted India’s potential growth from 5% to >6%. However, we seem to have reversed some of those trends and failed to increase the trend growth.
Table 1: Forget 8%, India GDP growth has been below 6.5% 10+ years
| % yoy | Post ‘Fragile Five’ | Demonetization, GST, RERA, Credit Crisis | Covid Period | Post Covid | Since Modi as PM |
|---|---|---|---|---|---|
| Average for the period | For QE Sept-2014 to Sept-2016 | For QE Dec-2016 to Dec -2019 | For QE Mar-2020 to Sept-2022 | For QE Dec-2022 to Mar-2025 | For QE Sept-2014 to Mar-2025 |
| Real GDP | 7.99 | 6.19 | 3.61 | 6.88 | 6.23 |
| Nominal GDP | 10.77 | 9.87 | 11.06 | 9.32 | 10.50 |
(Source: CMIE Economic Outlook, QE=Quarter Ended; shaded for levels below 6.5%; ‘Fragile Five – refers to period between 2011-2013, when India was bracketed with countries which were vulnerable due to high external current account deficit and inflation in an era of tightening FED policy and strong dollar; Demonetisation, Goods and Service Tax implementation, RERA – Real Estate Regulation Act – caused some distress in the informal and formal economy and and led to growth slowing down. Credit crisis refers to the financial system impact post the collapse of Il&FS, September 2018; Post COVID - we assume the quarter post September 2022 to be period from which y-o-y numbers are not impacted by covid period base effects; Under NDA government with Mr Narendra Modi as PM which started in May 2014, GDP data taken from June-September 2014 quarter)
An 8% real GDP growth, with a 40% investment to GDP ratio, would mean an incremental annual increase in investments rate of ~USD 300 billion, funded by an ~USD 100-150 billion of new capital flows every year. This could be possible.
The reason we need India to grow at ~8% real GDP growth is to ensure that the demographic dividend of a young population is realised by being able to provide them with a fair paying job which will ensure that India’s per capita income rises towards being a middle-income country.
Chart 3: India’s employment and income share is much below levels of other countries when they were at similar levels of development.
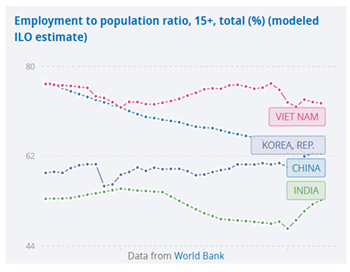
Line chart of employment-to-population ratio (15+) comparing Vietnam, Korea, China, and India; Vietnam remains highest, Korea and China are mid-range with slight declines, while India is lowest with a dip followed by recent recovery.
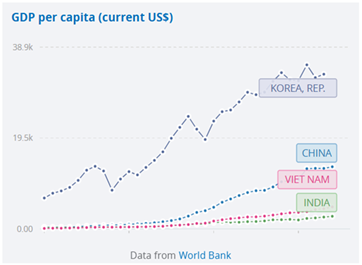
Line chart of GDP per capita showing Korea far ahead and rising strongly, China growing rapidly, Vietnam steadily increasing, and India remaining lowest but gradually improving.
(Source: World Bank, Data from 1990-2024); ILO – International Labour Organisation; Legend: As of 2024, India’s Employment to population ratio was 53% and per capita income was 2,696 USD); The recent spike in India’s employment share seen in the chart is due to women’s household and own farm work being counted and reported as employed.
For now, we do not see visible signs of a sustained increase in India’s trend GDP growth rate. We would continue to expect India’s real GDP growth to be around 6.0%-6.5%.
Having realistic long-term growth estimates is essential for investing in India. We have seen investors in the past getting swayed by the hype of 8-9% growth and making risky allocations with the hope of unrealistic higher returns. We maintain that investing in India based on a 6.0%-6.5% real GDP with reasonable linked expectations to that growth is important for investors.
Historically, there has been a strong correlation between India’s nominal GDP growth and stock market returns. Since 2000, India’s real GDP growth has averaged around 6.3% per annum (INR). This consistent real GDP growth has driven double-digit nominal GDP growth, with a compound annual growth rate (CAGR) of 12.0% in INR and 8.9% in USD. This economic growth has reflected in the Indian stock market returns, as shown by the MSCI India Index, which has a CAGR of 10.7% in INR and 7.8% in USD.
Chart 4: India: Where GDP growth has been rewarded by stock market returns
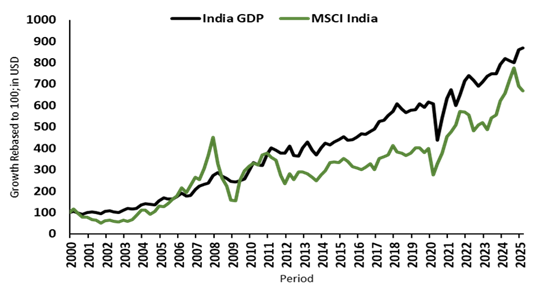
Source: Bloomberg & MSCI, All data in USD, GDP and Index data is quarterly till Mar 2025. This is only for representation and understanding purpose and does not assure any promise or guarantee of same in the future. Past performance does not guarantee and is not indicative of future results
We see no signs of a sustained increase in the GDP growth rate beyond the long-term average of 6.0%-6.5%. Hence, return expectations from India assets should remain anchored to this range.
Sources and Footnotes: for reference
- 1 - Goldman Sachs Investment research ‘Dream onto 2050’, 2003 – BRIC
- 2 - BBC news article on Fragile Five, 2013
- 3 - Ache Din Ad campaign by BJP - YouTube
- 4 - Atma Nirbhata economic package released by government – during COVID – IndiaBudget
- 5 - Amrit Kaal was first used by PM Modi for the next 25 years roadmap in the independence day speech in 2021 – Article in Quint
- 6 - CMIE Economic Outlook, ICOR Data calculated using real GDP %yoy and Gross Domestic Capital Formation as a % of GDP
- 7 - CMIE Economic Outlook – India’s nominal exports in USD
- 8 - Reuters article on Apple moving to make most iphones in India, April 2025
Important Disclosures & Disclaimers
The views expressed herein shall constitute only the opinions and any information contained in this material shall not be deemed to constitute an advice or an offer to sell/purchase or as an invitation or solicitation to invest in any security and further Quantum Advisors Private Limited (QAPL) and its employees/directors shall not be liable for any direct or indirect loss, damage, liability whatsoever arising from the use of this information.
Information sourced from third parties cannot be guaranteed or was not independently verified. Whilst no action has been solicited based upon the information provided herein, due care has been taken to ensure that the facts are accurate, and the views given are fair and reasonable as on date. All the forward-looking statements made in this communication are inherently uncertain and we cannot assure the reader that the results or developments anticipated will be realized or even if realized, will have the expected consequences to or effects on, us or our business prospects, financial condition or results of operations.
The security /sector discussed in this newsletter are given purely as illustration. This should not be construed as a recommendation to buy or sell any security/sector.
Recipients should exercise due care and caution and if necessary, obtain the professional advice prior to taking any decision based on this information.
Important Notice:
This newsletter contains hyperlinks to websites operated by third parties. These linked websites are not under the control of QAPL and are provided for your convenience only. Clicking on those links or enabling those connections may allow third parties to collect or share data about you. When you click on these links, we encourage you to read the privacy notice of the website you visit. QAPL does not endorse, or guarantee products, services or advice offered by these websites.
Our Strategies
Explore how our two main strategies – Predictable India Equity and India Integrity Equity - with demonstrated success of our tried and tested research and investment processes can ensure your India equity allocation will have higher predictable outcomes and no surprises.
Q India Value Equity Strategy
20+ years of India Long-only, Liquid, High-Governance, Margin of safety = Predictability
Integrity screen since 1996, strategy Track record since 2000.
Q India Responsible Returns Strategy
Liquid, proprietary Integrity Scores, Financial Soundness
Integrity Screen since 1996, enhanced criterion since 2015, strategy Track Record since 2019; strategy AuM: $9.7 mn Mandate Capacity: $5 billion
Quantum Advisors pioneered a quantitative as well as qualitative analytical approach to equity investing in India, providing for the first time, consistently applied valuation metrics to evaluate investment opportunities in India’s emerging stock markets. Over the years, Quantum Advisors has continued and enhanced its tradition of extensive financial analysis and value investing, as it has evolved into an investment advisor and asset manager.
Our investment philosophy and strategy involves the use of intensive qualitative and quantitative fundamental analysis. We build and monitor our clients’ portfolios actively while at the same time avoiding excessive trading, and control risk by endeavoring to keep our clients’ portfolio adequately diversified, both in terms of the sectors included in those portfolios, as well as with respect to the level of concentration in any specific security.