


Many Apples a Day to Keep Unemployment at Bay
Quantum Advisors India
Building your India portfolio since 1990 on a foundation of ethics, integrity & disciplined investment research process.
April 2, 2023Tim Cook, the CEO of Apple, is India's newest celebrity. The opening of the first Apple store in India, in Mumbai and Delhi, is all the rage. Tim's face is all over print, online and social media. Apple users and lovers have waited in queues for the store launch. The allure of the Apple store experience and India's penchant for shopping would mean footfalls will remain high.
The question though is how many Indians can afford an Apple product. Among the countries which have an Apple Store, India has the lowest per-capita income.
However, what India has is size. Even with average per capita income below USD 3,000; India has ~70 million households (~300 million people) who can afford an i-phone or an apple product. That is indeed a large market. Apple is playing in India on the proverbial hope of the rising Indian consumer class.
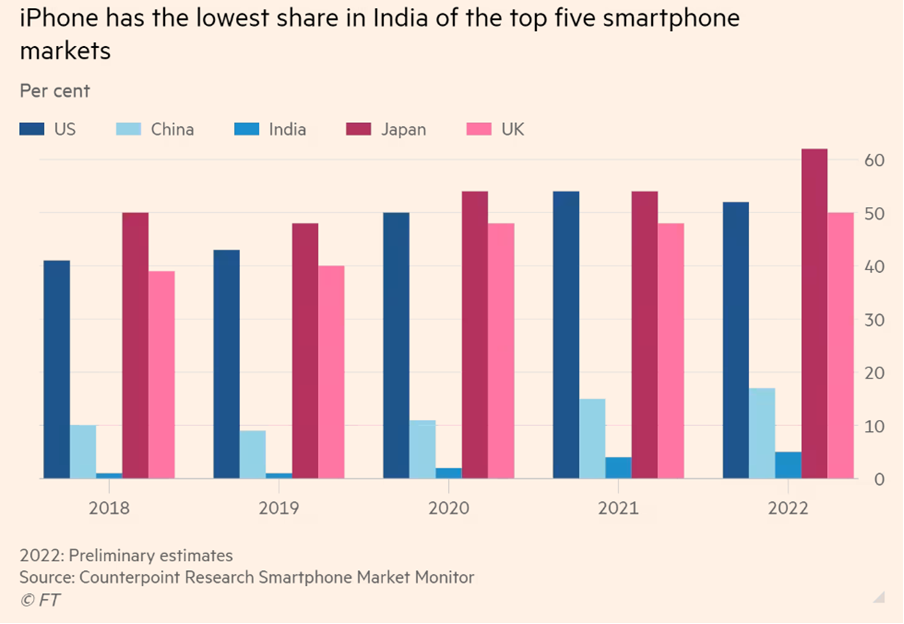
Source: Counterpoint Research Smartphone Market Monitor, 2022 (Preliminary estimates)
However, what is getting us excited is not Apple opening its store. It is Apple producing its products in India and exporting to the world.
Apple's suppliers, Foxconn, Pegatron and Wistron began assembling the i-phone in India in 2021. From 1% of global production, reports suggest that as of March 2023, India is producing ~7% of global i-phone production. An earlier Bloomberg report had suggested that Apple is looking to increase it to 25% by 2025-2026.
Apple sold ~USD 200 billion worth of i-phones in 2022. Assuming it has a 50% margin, that would mean, Apple's suppliers make i-phones worth ~USD 100 billion. 25% of that would mean the Indian assembly would be about USD 25 billion by 2026. assuming 80% of that is exported, that would mean USD 20 billion of gross exports.
An operation of that size would spawn an eco-system of companies, technologies and skill levels which would be helpful in other aspects of electronics and consumer durables production.
India needs many more such investments from global producers. It is imperative that Apple succeeds and crowds in other fortune 500 global corporations to look at India as a production, assembly, outsourcing base.

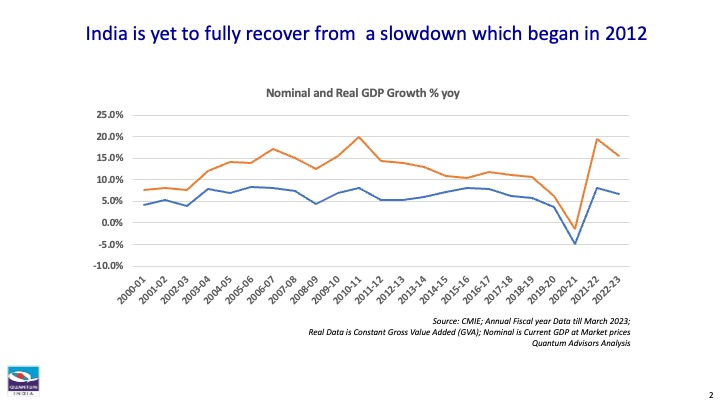
Source: CMIE; Annual Fiscal year Data till March 2023; Real Data is Constant Gross Value Added (GVA); Nominal is Current GDP at Market prices; Quantum Advisors Analysis
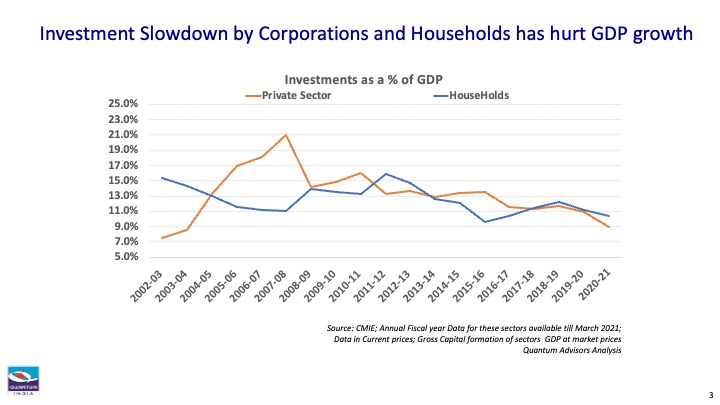
Source: CMIE; Annual Fiscal year Data for these sectors available till March 2021; Data in Current prices; Gross Capital formation of sectors; GDP at market prices; Quantum Advisors Analysis
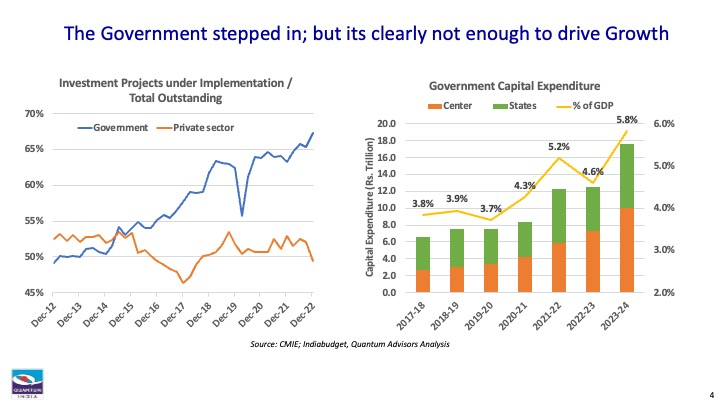
Slide with two charts titled “The Government stepped in; but it’s clearly not enough to drive Growth.” Left chart shows the government share of investment projects under implementation rising from about 50% in 2012 to nearly 67% in 2022, while the private sector share declines. Right chart shows government capital expenditure by center and states increasing from 2017–18 to 2023–24, with total spending reaching 5.8% of GDP.
Source: CMIE; Indiabudget; Quantum Advisors Analysis
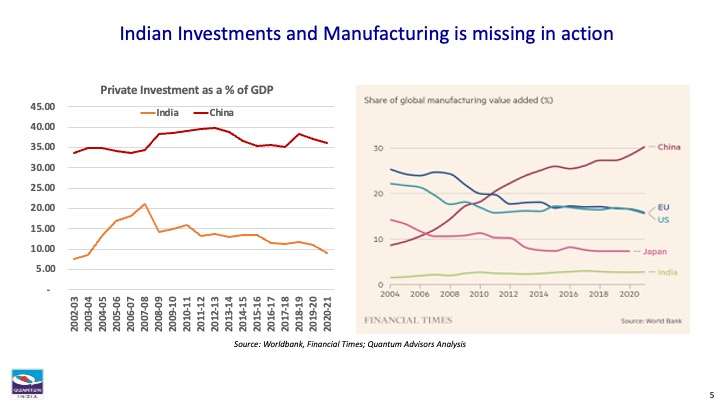
Slide titled “Indian Investments and Manufacturing is missing in action.” Left chart compares private investment as a share of GDP in India and China from 2002–03 to 2020–21, showing China consistently much higher while India rises until around 2007–08 and then declines. Right chart shows share of global manufacturing value added from 2004 to 2020, with China rising strongly, the US and EU gradually declining, Japan falling, and India remaining low and mostly flat.
Source: Worldbank, Financial Times; Quantum Advisors Analysis
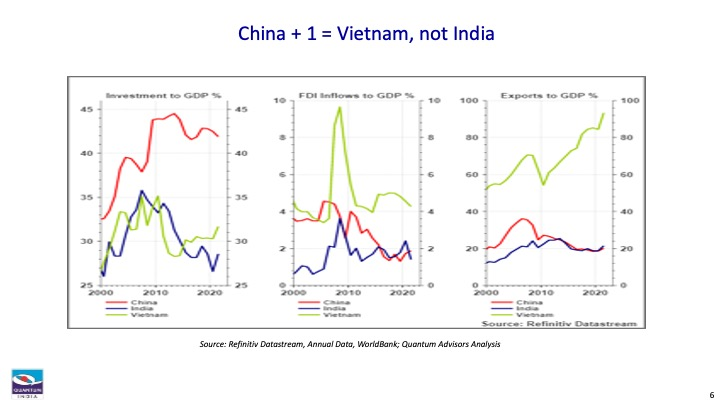
Slide titled “China + 1 = Vietnam, not India,” with three line charts comparing China, India, and Vietnam from 2000 to the early 2020s on investment-to-GDP, FDI inflows-to-GDP, and exports-to-GDP.
Source: Refinitiv Datastream, Annual Data; WorldBank; Quantum Advisors Analysis

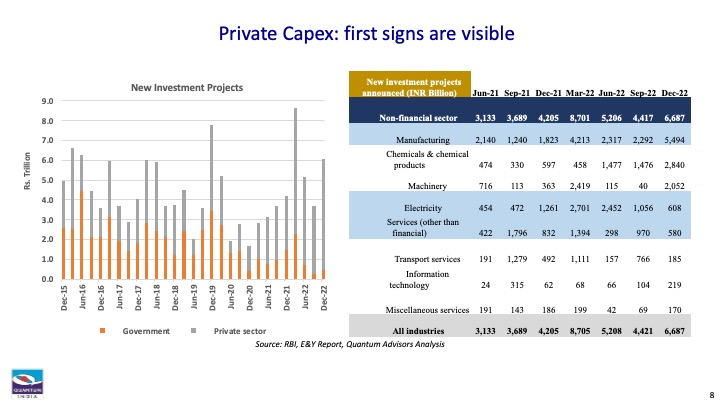
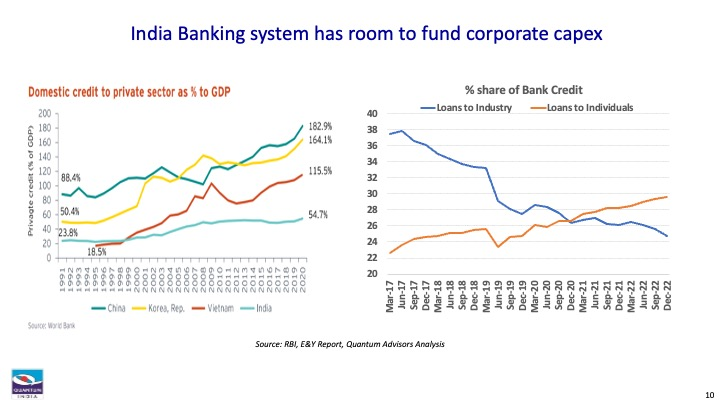
Source: RBI; E&Y Report; Quantum Advisors Analysis
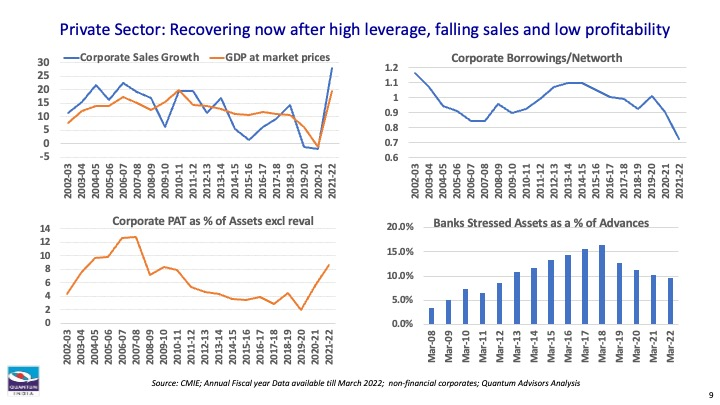
Slide titled “Private Sector: Recovering now after high leverage, falling sales and low profitability,” with four charts showing Indian corporate trends from the early 2000s to 2021–22. Corporate sales growth and GDP growth fluctuate, borrowings-to-net worth decline after peaking in the mid-2010s, profitability falls for several years before recovering, and banks’ stressed assets rise sharply until 2017–18 before easing thereafter.
Source: CMIE; Annual Fiscal year Data available till March 2022; non-financial corporates; Quantum Advisors Analysis
Source: RBI; E&Y Report; Quantum Advisors Analysis
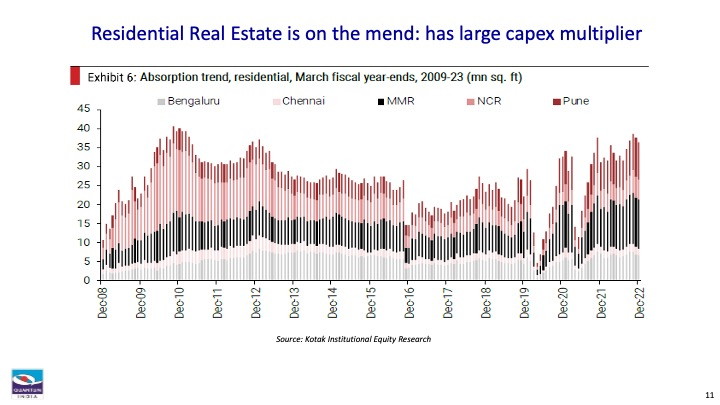
Stacked bar chart showing residential absorption in Bengaluru, Chennai, MMR, NCR and Pune.
Source: Kotak Institutional Equity Research
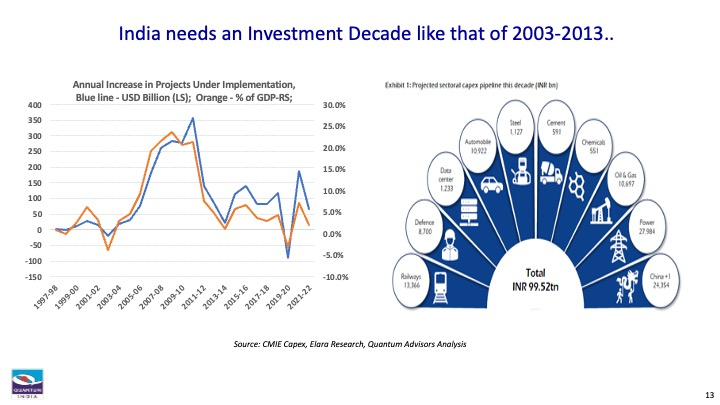
Slide titled “India needs an Investment Decade like that of 2003–2013..” Left chart shows annual increases in projects under implementation from 1997–98 to 2021–22 in both US dollar terms and as a share of GDP, with the strongest surge during the mid-2000s to early 2010s, followed by weaker and volatile growth. Right infographic shows a projected sectoral capex pipeline totaling INR 99.52 trillion, led by power, oil and gas, China+1, railways, defence, data centers, automobiles, steel, cement, and chemicals.
Source: CMIE Capex; Elara Research; Quantum Advisors Analysis
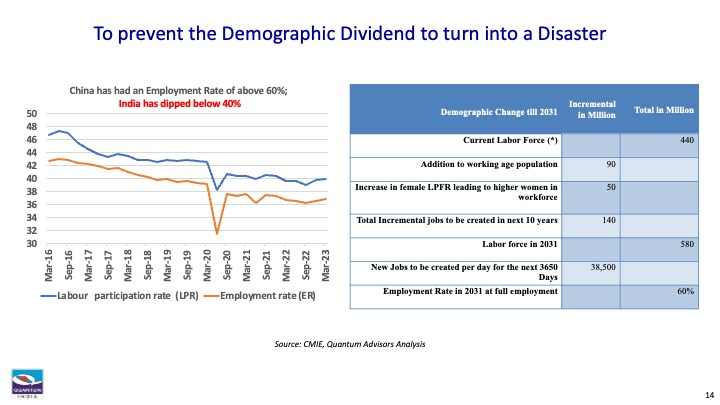
Slide titled “To prevent the Demographic Dividend to turn into a Disaster.” Left chart shows India’s labour participation rate and employment rate from 2016 to 2023, both trending downward with a sharp dip in 2020; the employment rate remains below 40%. Right table outlines labour force projections to 2031, showing a current labour force of 440 million, a total projected labour force of 580 million, and a need to create about 140 million additional jobs, or roughly 38,500 jobs per day.
Source: CMIE; Quantum Advisors Analysis
Contact details slide with four profile cards listing names, titles, regions, mobile numbers, and email addresses for Arvind Chari, Sam Tully, Kevin Heller, and Roger Mortimer, along with small headshots.p> 

India not only needs the investments, but it needs these investments to create jobs for its young population.
Apple's suppliers have created 100,000 direct jobs in the last 2 years. As they scale capacity, they will create more jobs. The pleasing aspect is that 70% of these jobs have gone to women.
India needs to create ~>27,000 jobs per day for the next 10 years to absorb its growing young workforce. It will need to add more, to absorb movements away from agriculture. India's dismal female labor force participation will also rise as salaries rise enough to motivate women to seek work outside the homes leading to more job demands.
Getting Apple into India is indeed a success. The Government's Production Linked Incentive (PLI) which is applicable to Apple's suppliers as well is ambitious. The government will dole out incentives worth USD 25 billion in a 5 year period and estimates production value of ~USD 400 billion and new job creation of 6,000,000. That is ~3,750 jobs per day over the next 5 years.
For India's demography to remain a Dividend and not turn into a disaster, India needs Many Apples a Day to keep unemployment and social tensions at Bay!
Related Post
India: T I N A to A N T I
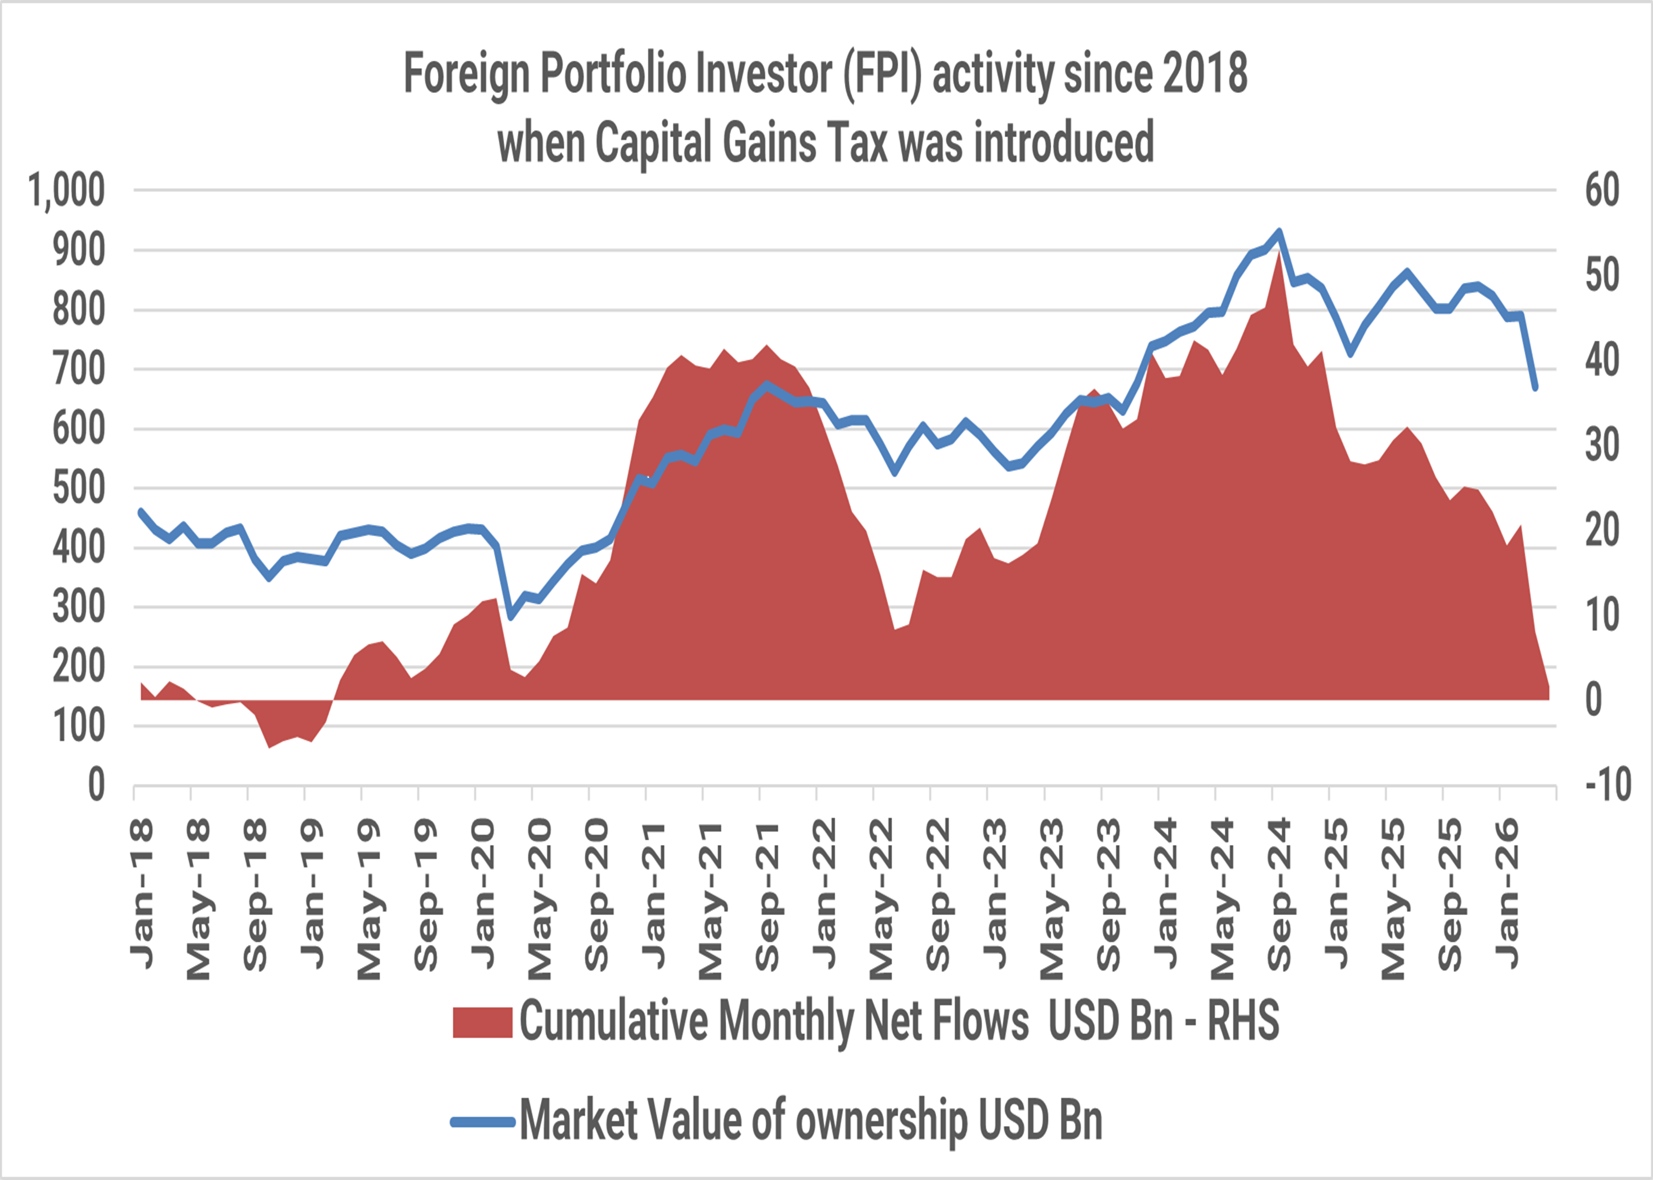
The Indian public equity markets peaked in September 2024. Since then, foreign investors have sold USD 51 billion till April 2026. The market value of foreign investor holding in Indian equities has fallen from USD 930 billion in September 2024 to USD 670 billion, a ~30% drop as at the end of March 2026.

India Investing: From a complicated 2025 to a Simpler 2026?
The simple India investing story of double-digit nominal GDP growth reflecting in stock market returns even in dollar terms has faced some headwinds in 2024/2025. Are these headwinds structural? What should investors expect in 2026?
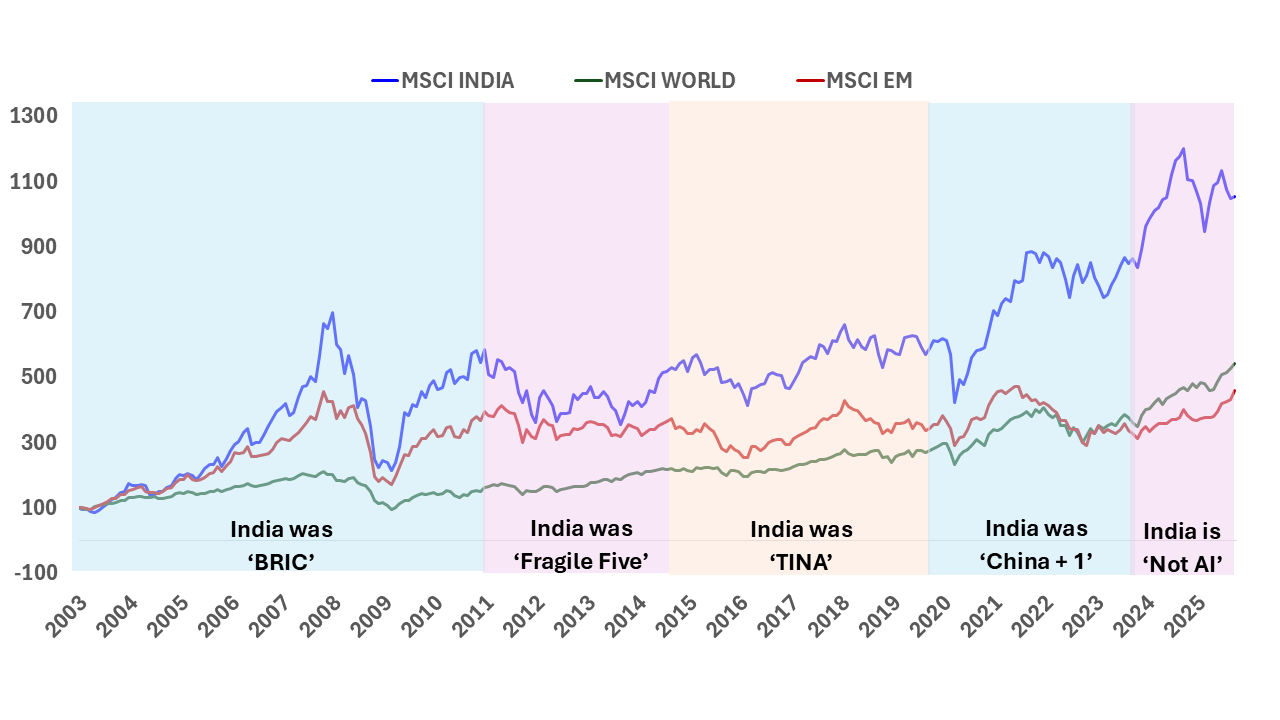
India Investing Under Global Mood Swings
The narrative around global investing is often built around stories. Investors weave these stories around cycles, themes, and opportunities to justify and support their investment rationale.

The Great India Under-Allocation
The most common response to our reach outs to prospective Global Investors to get them interested in Indian Equities is ‘NO’ response.
Our Strategies
Explore how our two main strategies – Predictable India Equity and India Integrity Equity - with demonstrated success of our tried and tested research and investment processes can ensure your India equity allocation will have higher predictable outcomes and no surprises.
Q India Value Equity Strategy
20+ years of India Long-only, Liquid, High-Governance, Margin of safety = Predictability
Integrity screen since 1996, strategy Track record since 2000.
Q India Responsible Returns Strategy
Liquid, proprietary Integrity Scores, Financial Soundness
Integrity Screen since 1996, enhanced criterion since 2015, strategy Track Record since 2019; strategy AuM: $9.7 mn Mandate Capacity: $5 billion
Quantum Advisors pioneered a quantitative as well as qualitative analytical approach to equity investing in India, providing for the first time, consistently applied valuation metrics to evaluate investment opportunities in India’s emerging stock markets. Over the years, Quantum Advisors has continued and enhanced its tradition of extensive financial analysis and value investing, as it has evolved into an investment advisor and asset manager.
Our investment philosophy and strategy involves the use of intensive qualitative and quantitative fundamental analysis. We build and monitor our clients’ portfolios actively while at the same time avoiding excessive trading, and control risk by endeavoring to keep our clients’ portfolio adequately diversified, both in terms of the sectors included in those portfolios, as well as with respect to the level of concentration in any specific security.