


Waltz with India Directly, Don’t Dance through GEM
Quantum Advisors India
Building your India portfolio since 1990 on a foundation of ethics, integrity & disciplined investment research process.
July 2, 2023A recent shift in public equity allocation strategies is driving investors away from China and towards other Emerging Markets, notably India. Prompted by China's underperformance and political concerns, this change raises key questions about appropriate portfolio weightage, risk, and the historical track record of Emerging Market ex-China allocations. While global benchmarks have traditionally guided allocation decisions, an increased focus on India, with its growing role in the global economy, suggests the need for a dedicated investment approach.
Over the last 2 years, we have seen a new allocation trend in public equities. Strung by the under performance of China, impacted by the political concerns over investing in China or the desire to invest in China directly, has made allocators to look for Emerging Markets (EM) ex China allocation.
We have seen a few RFPs (Request for Proposals) being floated by asset owners and wealth managers asking for such an allocation. The ETF industry of course has been quick to respond to this demand and has seen new launches and increasing AuM flowing into such products.
Chart 1: Flows increase to EM ex China allocation
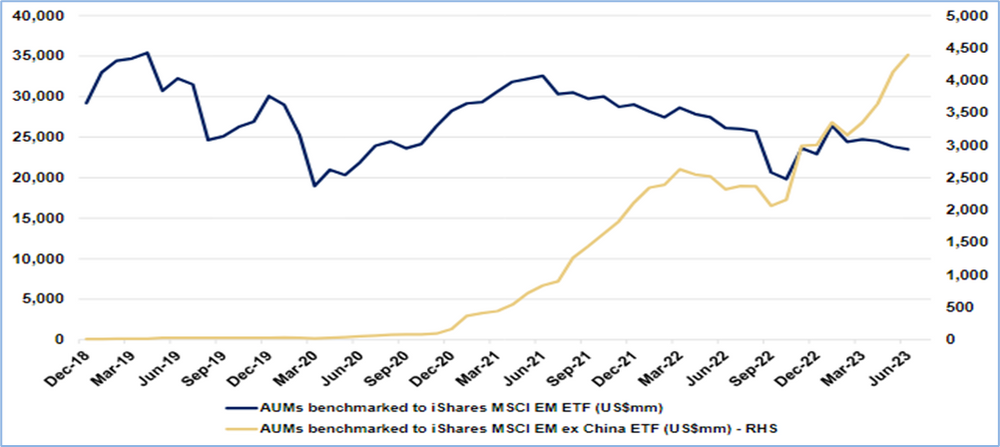
Dual-axis line chart (Dec 2018–Jun 2023) showing AUMs in MSCI EM ETF fluctuating, while AUMs in MSCI EM ex-China ETF rise sharply from near zero to about $4.5 billion.
(Source: Morgan Stanley Research)
India’s weight will be higher in an EM ex China allocation. Investors will be better off from the India market performance than an EM allocation. However, there are few issues in such an allocation:
- What allocation percentage does this deserve? How do you weight this in your portfolio?
- No past Performance track record of a EM ex-China Allocation
- Country and Stock Allocation and what that means for risk and return
- Re-weighting based on re-allocation of China weights as per stocks, sectors, countries?
- What does larger weights in countries like Taiwan, South Africa, Saudi Arabia, Qatar as few examples mean to overall return, risk, geo-politics, exposures.
We have argued against Emerging Markets as a basket investment. It does give diversification but the countries classified as EM are so dramatically different. It is no surprise that over the last decade EM as an allocation has been such a laggard.
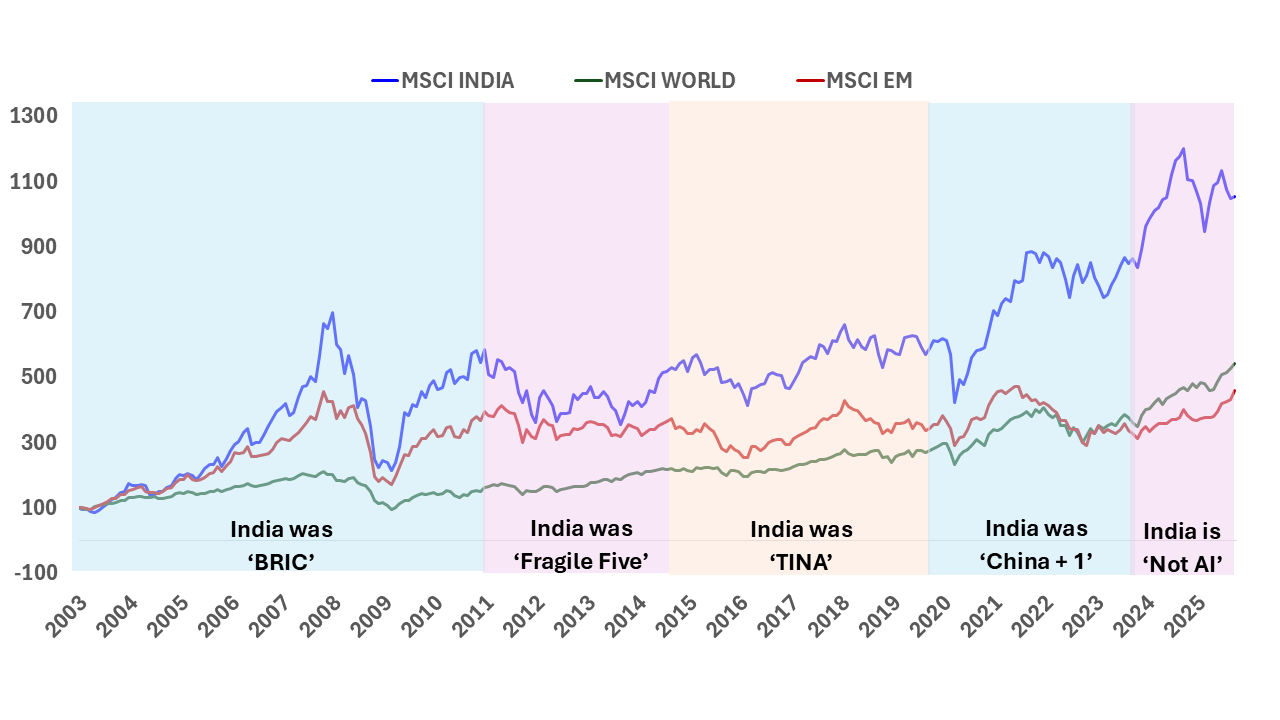
Chart 2: Emerging Markets as an allocation has been disappointing
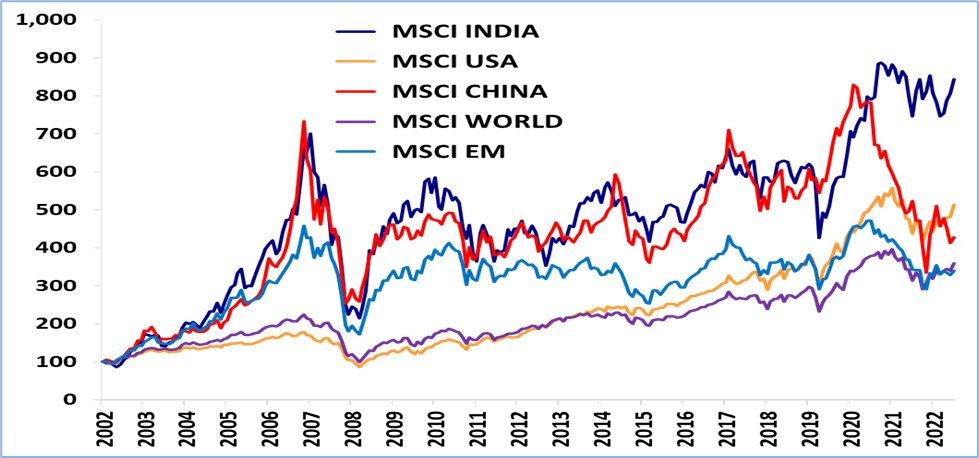
Line chart (2002–2022) comparing MSCI India, USA, China, World, and Emerging Markets indices, showing India and China as more volatile but higher-returning, with India leading in recent years.
Source: MSCI Indices, 20-year data; rebased to 100 from December 2002 till June 2023
India and China seems to have kept up the overall EM performance for some time. However, post 2020 given China’s correction, even that has led to a big drag on EM performance.
Active managers India weights have also been all over the place and as we know Global Emerging Market (GEM) and Global Funds have been large net sellers in Indian equities in 2021/22 to ensure that the India weight remains close to its benchmark weight.
Chart 3: India’s relative outperformance forces EM managers to sell India
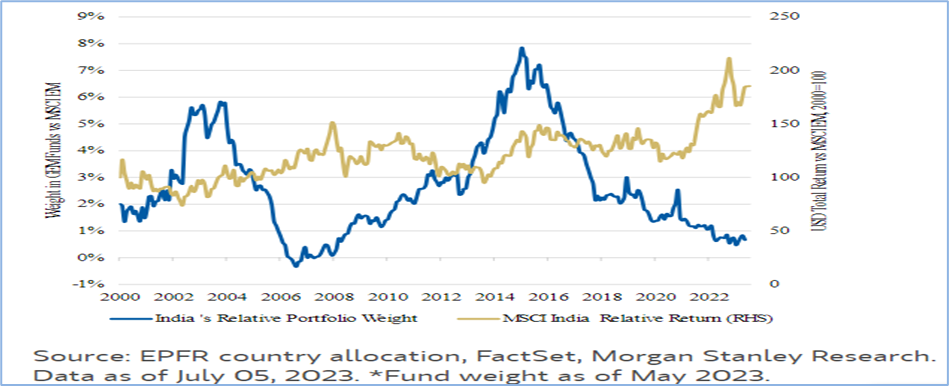
Dual-axis chart (2000–2023) showing India’s portfolio weight in EM funds declining in recent years while MSCI India’s relative returns trend upward over the long term.
(Source: Morgan Stanley Research)
We understand allocators problems on thinking of a dedicated India allocation. However, how long can they ignore India’s secular long-term outperformance to EM and China.
Chart 4 and 5: Under allocation to India hurts your overall performance.
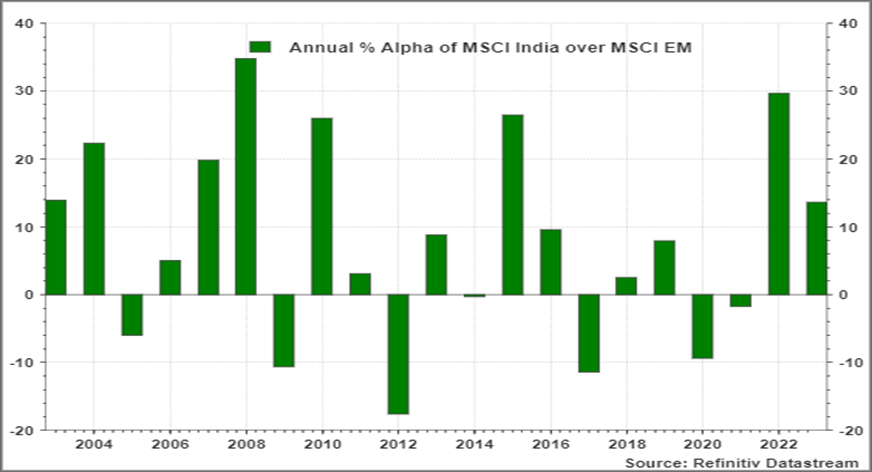
Bar chart of annual alpha of MSCI India versus MSCI Emerging Markets (2003–2023), showing alternating periods of outperformance and underperformance, with several years of strong positive alpha.
Source:
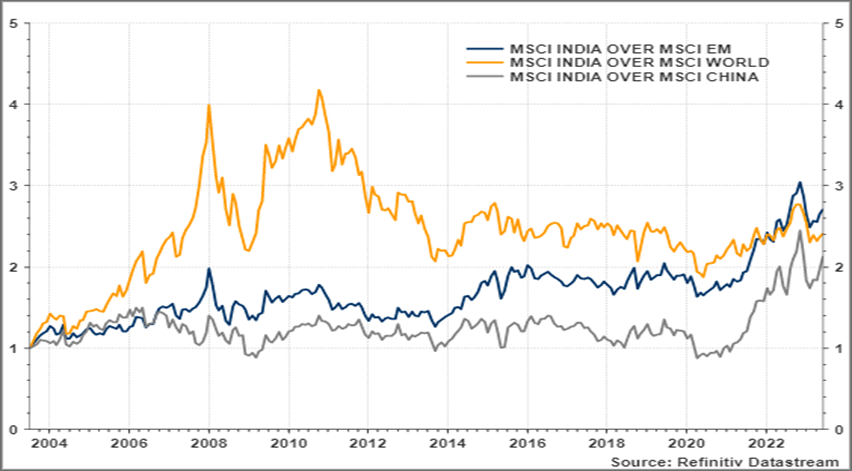
Line chart (2004–2023) showing MSCI India’s relative performance versus EM, World, and China, indicating consistent outperformance—especially versus World and China—in recent years.
Source:
As we have shown over many of our commentaries, that global investors needs to think of a dedicated allocation to India. By choosing to benchmark their allocation to an ‘artificially’ constructed Emerging Markets Index or a sleeve of that with EM ex-China, is lazy and is acting against their own interests. It is very difficult to comprehend and or predict, what a basket of countries and stock weightings as decided by an index provider means to your risk and return.
We recognize the difficulty of an asset allocator to move away from the ‘tyranny of the benchmark’ as referred to by a CIO of a public pension plan. The investing world is bound by reference benchmarks, reference portfolios and hence reference allocations.
Asset allocators who invest for decades in the future though need to make that decision to have higher allocations in high conviction investment avenues.
In todays, economic and geo-political world, India is by far the only country where an investor can make a long-term, strategic, secular allocation across all asset classes.
One way to look at an India allocation is think about India’s share of global GDP (~3%) and its likely trajectory 10-20 years out to ~5%). And then look at your effective allocation to India as part of a EM or EM ex-china allocation. Then use a dedicated India allocation over and above your effective weight to reflect India’s growing share in the global economy.
Chart 6: India’s economic growth is reflected in Market Returns
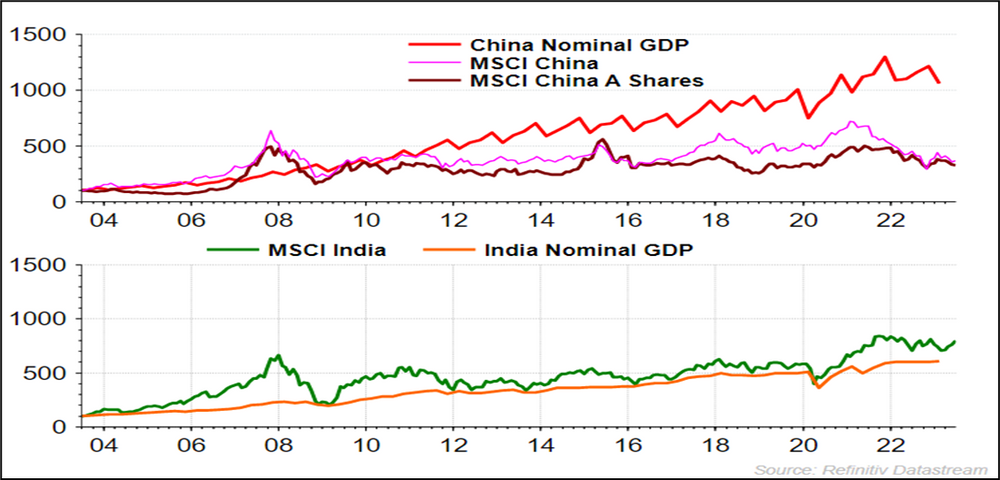
Two-panel line chart (2004–2023) comparing GDP and equity markets—China’s GDP rises steadily while its equity indices lag, whereas India’s equities track and outperform its steadily growing GDP.
Source:
Chart 7: India cannot be ignored anymore
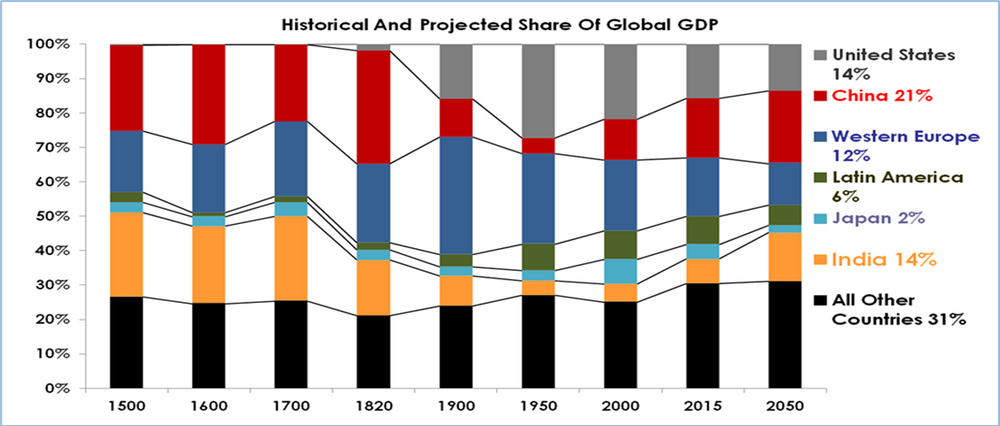
Stacked bar chart (1500–2050) showing shifts in global GDP share, with China and India rising over time, the U.S. stabilizing, and Europe and Japan declining in relative share.
Source:
Related Post
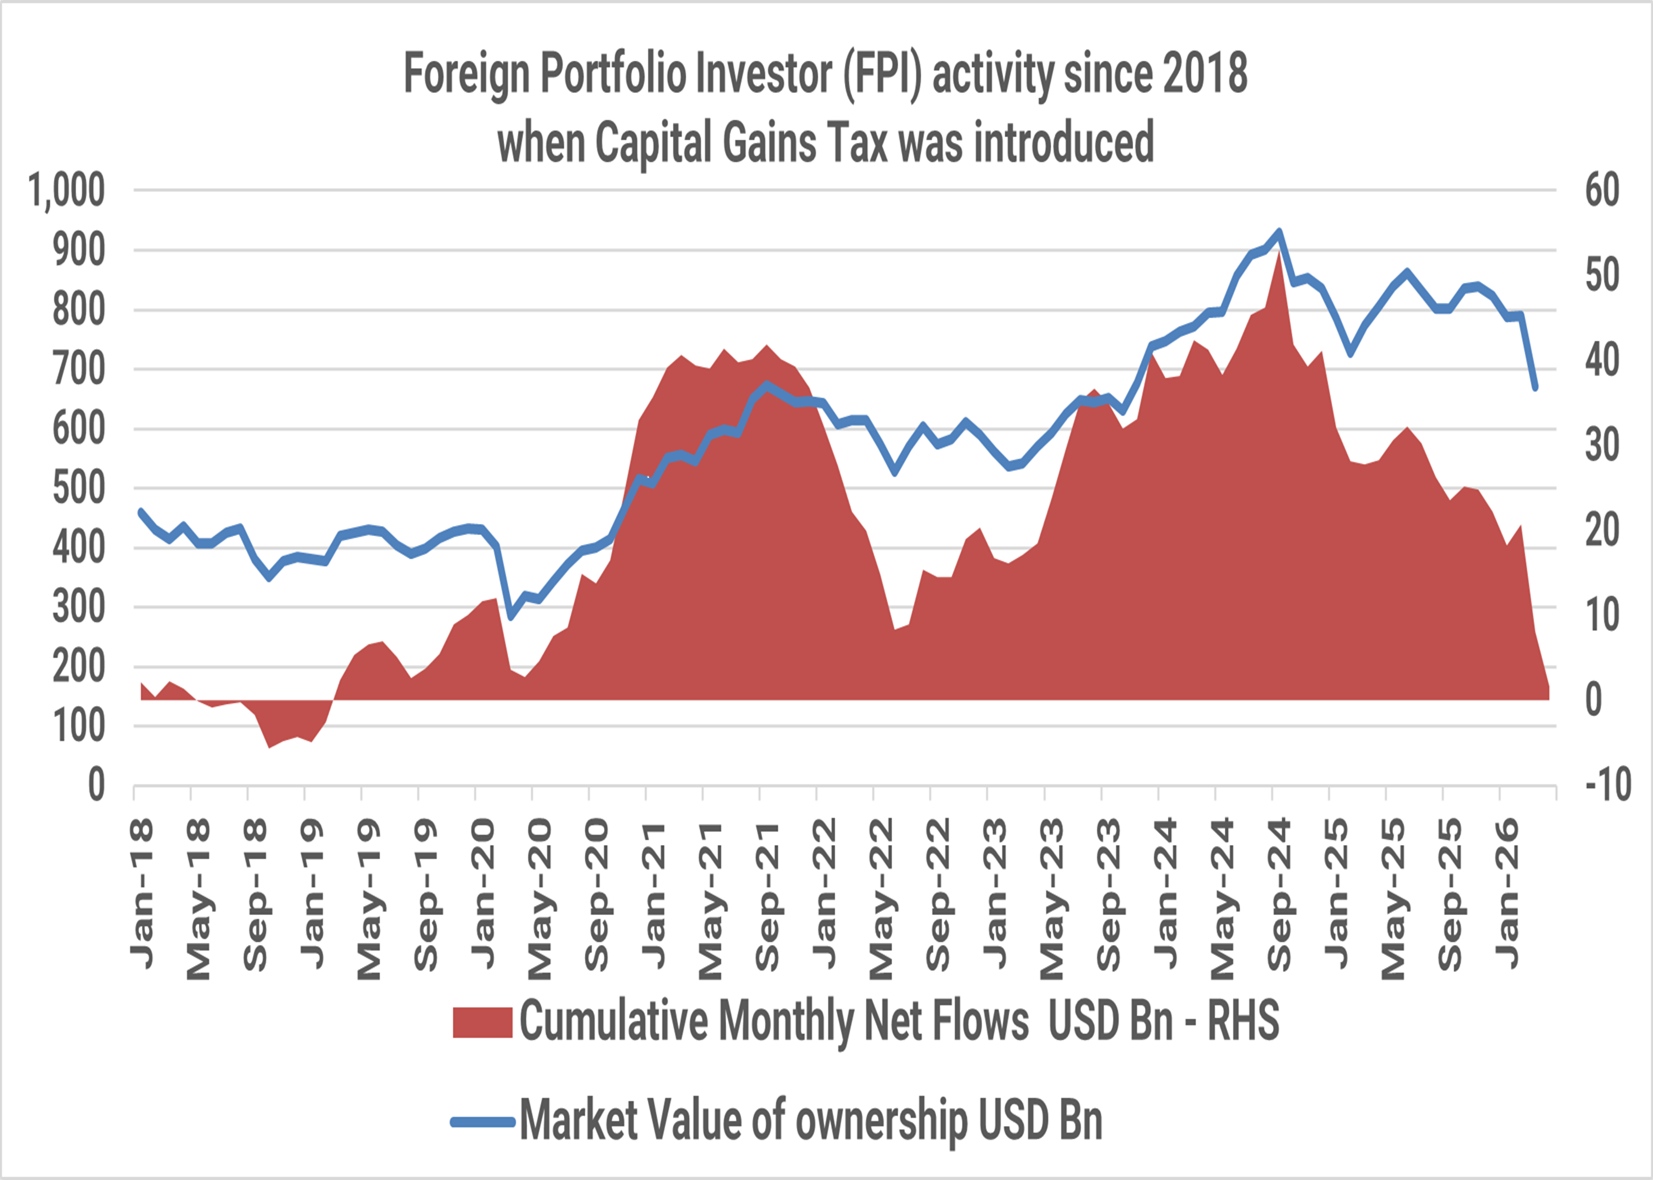
India: T I N A to A N T I
The Indian public equity markets peaked in September 2024. Since then, foreign investors have sold USD 51 billion till April 2026. The market value of foreign investor holding in Indian equities has fallen from USD 930 billion in September 2024 to USD 670 billion, a ~30% drop as at the end of March 2026.

India Investing: From a complicated 2025 to a Simpler 2026?
The simple India investing story of double-digit nominal GDP growth reflecting in stock market returns even in dollar terms has faced some headwinds in 2024/2025. Are these headwinds structural? What should investors expect in 2026?
India Investing Under Global Mood Swings
The narrative around global investing is often built around stories. Investors weave these stories around cycles, themes, and opportunities to justify and support their investment rationale.

The Great India Under-Allocation
The most common response to our reach outs to prospective Global Investors to get them interested in Indian Equities is ‘NO’ response.
Our Strategies
Explore how our two main strategies – Predictable India Equity and India Integrity Equity - with demonstrated success of our tried and tested research and investment processes can ensure your India equity allocation will have higher predictable outcomes and no surprises.
Q India Value Equity Strategy
20+ years of India Long-only, Liquid, High-Governance, Margin of safety = Predictability
Integrity screen since 1996, strategy Track record since 2000.
Q India Responsible Returns Strategy
Liquid, proprietary Integrity Scores, Financial Soundness
Integrity Screen since 1996, enhanced criterion since 2015, strategy Track Record since 2019; strategy AuM: $9.7 mn Mandate Capacity: $5 billion
Quantum Advisors pioneered a quantitative as well as qualitative analytical approach to equity investing in India, providing for the first time, consistently applied valuation metrics to evaluate investment opportunities in India’s emerging stock markets. Over the years, Quantum Advisors has continued and enhanced its tradition of extensive financial analysis and value investing, as it has evolved into an investment advisor and asset manager.
Our investment philosophy and strategy involves the use of intensive qualitative and quantitative fundamental analysis. We build and monitor our clients’ portfolios actively while at the same time avoiding excessive trading, and control risk by endeavoring to keep our clients’ portfolio adequately diversified, both in terms of the sectors included in those portfolios, as well as with respect to the level of concentration in any specific security.