


A Value Manager in a Growth Market
Quantum Advisors India
Building your India portfolio since 1990 on a foundation of ethics, integrity & disciplined investment research process.
July 13, 2021What is a 'Value Manager' doing in India? - In our more than 30 years of existence as a firm and more than 20 years of directly managing India dedicated public equities for clients, we have been asked this question several times.
It of course stems from the fact that India is a 'Growth' market and hence 'Growth' style of investing should be better suited for market returns.
It also construes from a mis-understanding about 'Value investing'. As we show in this piece, 'Value cannot survive without Growth'. The best periods of returns from following Value investing comes during periods of broadbased growth driven by investments and reasonable inflation. In these periods, Value tends to outperform growth and other styles of investing.
India has that broad-based, investment driven growth and it is of no surprise to us that over long-term time cycles, Value investing does extremely well in India.
Chart 1: Value does well in India
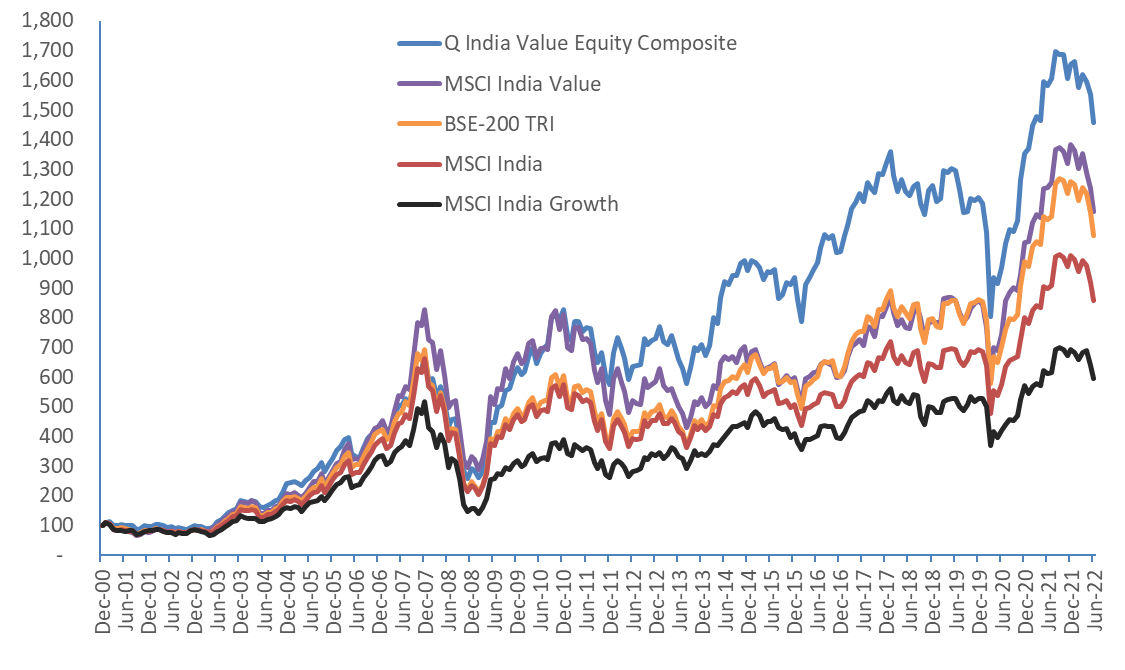
Source: Quantum Advisors, Refinitiv Datastream, MSCI Indices, in USD rebased to 100 on 31-Dec-2000 Data till June 30, 2022. Past performance is not an indicator of future returns. Please refer important disclosures and disclaimers
Value lies in the eyes of the Beholder
There is no easy definition of what construes as 'Value investing'. Indices when they construct a Value index, use certain relative parameters. They bracket stocks with for e.g. low price to earnings, low price to book value, high dividend yield as measures of Value style and create the Value index.
Value investors following the Graham & Dodd 'screener' would use a combination of relative value (with other stocks as well as other asset classes), financial metrics (growth, leverage, return ratios) to identify stocks trading at discount to fair value with the hope that the valuation will 'mean-revert' to fair value.
Warren Buffet and Charlie Munger, the legendary Value investors, will use a long-term normalised earnings for an operating company, the business of which they understand and they can remain invested for a long-time.
There are other investors who use what is called 'contrarian' investing. Again, the bet is 'mean-reversion' and thus buying when others are fearful or during periods of negative sentiment. We have also seen 'activist' investing looking at companies with depressed valuation either due to management or business cycles or capital structure. A good part of 'distressed asset investing also imbibes measures of value investing.
As you can see, there are many definitions and styles of investing to which Value investing can be ascribed.
Value = Discount to Fair Value + A Catalyst
Tom Hansberger, the founding member of the investment firm, what was then knows as Templeton, Galbraith and Hansberger', a legendary Value investor taught us the difference between a 'Value stock' and a 'cheap stock'. He told us that a cheap stock can remain cheap. A Value stock is one which is cheap but has a catalyst, a trigger which can lead to an improvement in earnings and valuations.
This aspect of stock returns driven by a catalyst and/or mean reversion has its pros and cons. Because, you are buying at a discounted price, the investor always has margin of safety. If the thesis/catalyst plays out, the investor can make superior returns.
The flip side is that things don't go as planned and the investor can suffer periods of poor performance. For instance, weak growth cycle can delay the impact of the catalyst. It can at times take longer than expected wherein there might be a time mismatch in terms of the manager and the client. The value stock may be a 'value trap' which was not identified. Investing behavior and investing cycles undergo changes which may also impact on the flow of funds into these value stocks/sector.
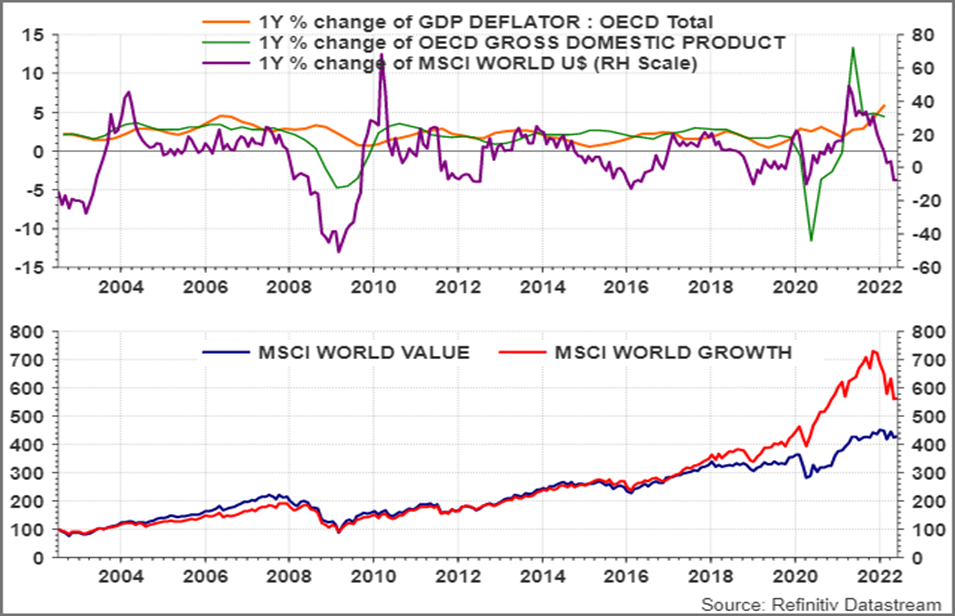
We saw in the years post the Lehman financial crisis till COVID, where in, global growth was anemic, interest rates were held very low and monetary policy dominated over fiscal policy. Such a period, saw a global underperformance of Value style or Value factor over all the other popular factor investing styles like Growth, Momentum and Quality.
Chart 2: Value underperformed when monetary policy was active over fiscal policy
We saw this play out in India as well. Even India went through a phase of low growth and low inflation. We found that during this period, stocks which could pose even a slightly higher growth than its peers, the 'Growth' or 'Quality' investors were willing to ascribe a far higher valuation for that incremental growth. At the same traditional value stocks/segments, suffered both in terms of incremental growth momentum and a sharp de-rating of its historical valuation.
However, as chart 1 suggests, in India, over the long-term 'Value' investing does well and much better than 'Growth' style of investing.
We lay down three broad reasons for the same: 1.Sentiment towards India goes through periods of optimism and pessimism, 2.Growth cycles naturally allow for mean-reversion of earnings and/or valuations. 3.India is in a steady long-term growth cycle which continues to broadbase and diversify the opportunity set for investors.
Chart 4: Growth cycle and investor sentiment allows for natural mean reversion of earnings and valuation
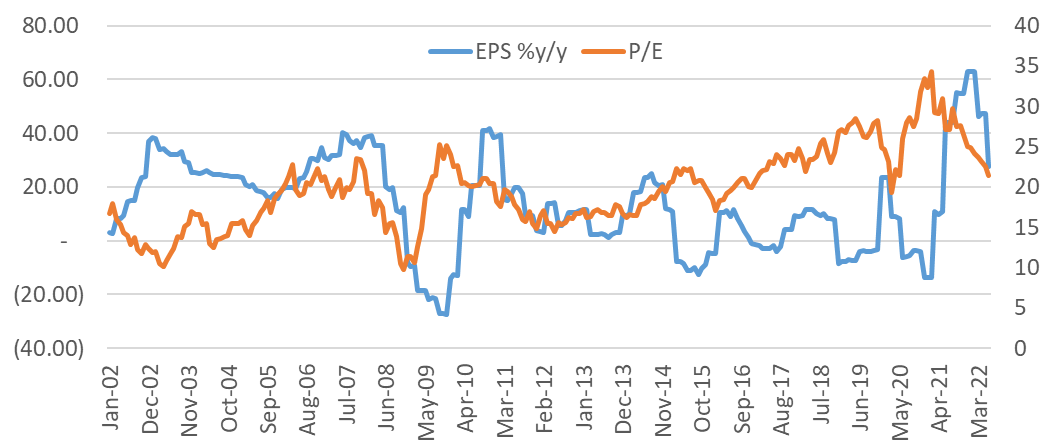
Source: Bloomberg Finance L.P , EPS and P/E for BSE-30 Sensex Index, trailing 12month data
A Value manager, with a long time horizon and an investment approach which assumes normalized earnings potential is better placed. If they are disciplined, they can ignore a stock re-rating due to flows or short term earnings momentum. At the same time, they can take advantage of a stock de-rating based on near term earnings disappointment or negative price sentiment towards the stock and sector.
As the chart above suggests, this happens regularly in India. Also, India's overall trajectory of 6.0%-6.5% real GDP growth has disappointed many investors and companies who committed money with an assumption of 9%-10% GDP growth.
A Value manager cognizant of a normalized trend and investing with a margin of safety seems better placed to deal with the volatility in expectations, sentiment and reality.
This does not take away from the fact that Value style can have some brutal years. 2017-2021 was one such period, where Value underperformed not only in India but also globally. Investors who back value managers need a longer time horizon and/or should balance the allocation with managers following other styles of investing.
We are confident in our process. We see signs of a broad-based fiscal, investment and credit led recovery. We are seeing lower polarizations in the stock indices with broad-based participation. All signs that tell us that Value investing should continue to do well.
Arvind Chari [email protected]
Arvind Chari is the Chief Investment Officer (CIO) at Quantum Advisors. Arvinds vast experience in managing money for global investors and his interactions with leading institutions has exposed him to a world of knowledge. With over 21 years of experience in tracking domestic and global economy he is Quantums thought leader and is the author of this Q-India Insight edition.
Important Disclosures & Disclaimers
- Q India Value Equity Composite (Composite) is an aggregation of Client portfolios with a similar investment mandate and with no cash restrictions that are managed or advised by Quantum Advisors on a discretionary basis using the long only value equity strategy. The Composite does not include all client portfolios due to various client-imposed portfolio restrictions, even though all portfolios in this broad mandate are managed using the same strategy.
- The various constituents of the Composite pay different management fees. The net-of-fee and expense returns of the Q India Value Equity Composite indicated in this presentation reflect the weighted average management fees paid to Quantum Advisors Pvt Ltd (QAPL) by the different constituents of the Composite. The Composite represents 0.03% of the total AUM under the Q India Value Equity Strategy as on June, 2022.
- As the different constituents of the Composite are subject to different management fee structures, the actual performance experienced by a constituent of the Composite may be worse or better than the net-of-fee-and-expense returns of the Composite.
- The return shown in the graph are calculated using Time Weighted Rate of Return (TWRR) method.
- The returns for CY 2011 to CY 2015 do not capture the impact of management fees paid by constituents of the Composite who pay such fees to QAPL from outside their portfolio accounts. From January 2016 onwards, the performance returns of the Composite is calculated net of management fees payable to QAPL whether the management fees are paid by the constituents from within or outside their portfolio account.
- Till December 2015, performance returns of certain constituents of the Composite were computed on a pre-tax basis while the returns of remaining constituents were computed on a post-tax basis. For the months of January and February 2016 the returns of all the constituents were computed on a post-tax basis, where tax was paid out of the Clients portfolio account. Effective March 2016, in order to bring the performance calculation practice in line with market practice, all return numbers have been computed on a pre-tax basis.
- The returns for CY 2006 to CY 2015 have been computed after adjusting the management fees received by QAPL from the constituents portfolio accounts on a receipt basis generally at calendar quarter intervals and have not been calculated on an accrual basis. Starting January 2016, the performance returns are calculated net of management fees payable to QAPL and are being accrued on a monthly basis.
- Till December 2015, the capital gain taxes (if any) paid by some of the constituents of the Composite were not considered while reporting performance numbers. Starting January 2016, the performance returns are being calculated after reducing capital gain taxes (if any) paid by all constituents of the Composite, for which payment of capital gain taxes are made from their respective portfolio account.
- The firm has formulated an internal policy and procedures on inclusion, exclusion of the portfolio accounts and factoring significant cash flows for computing the performance of Composite which will be available upon request.
- As of 1 January 2008, the benchmark for the Composite strategy was changed from the BSE 30 to the BSE 200. Since the investment universe is the companies constituting the BSE 200 Index or any appropriate additions made to it, the firm believes that the BSE 200 is a more appropriate benchmark and reflects a realistic comparison with portfolio performance. Hence, we believe that BSE 200 is more representative of the investment strategy since it includes most of the stocks in which the portfolio may invest.
- Given that the BSE 200 comprises large cap stocks which are highly liquid, we believe it makes a good benchmark as the Composites portfolio has a bias towards highly liquid stocks. However, the Composites performance may not be strictly comparable with the performance of the Benchmark, due to inherent differences in the construction of the portfolios, and the volatility of the benchmark over any period may be materially different than that of the composite over the same period.
- The firm sources benchmark-related data from Bloomberg. When the benchmark was changed on 1 January 2008, the Total Return Index values for S&P BSE 200 were not available on Bloomberg. Subsequently, Bloomberg began publishing index values for the S&P BSE 200 Total Return Index in February 2014. As the Total Return values are available now, the firm believes it to be the best practice to report the total return of the benchmark instead of the price returns.
- Data of other indices is provided for information purposes only and to allow investors to compare the performance of the Composite to that of certain indices (many of which are well known and widely recognized). While we generally believe these comparisons provide meaningful and useful information to investors (for example, as a way of comparing an investment in the Composite to other types of investments that investors might make), inclusion of any particular index is not a representation that the index is an appropriate benchmark for evaluating the Composites performance. In particular, the volatility of indices over any period may be materially different from that of the Composite over that same period.
- All INR to USD conversion has been done based on RBI FX Rates till May 2010, and WM Reuters Closing Spot Rates (4pm UK time) from June 2010 onwards. Average monthly cash level figures consist of month-end averages.
Annexure 1
Performance of the Q India Value Equity Composite computed as per methodology prescribed under SEBI guidelines
| Fund / Benchmark | Since Inception (Annualized) | 10 Years (Annualized) | 7 Years (Annualized) | 5 Years (Annualized) | 3 Years (Annualized) | 1 Year | 6 Months | 3 Months | 1 Month |
|---|---|---|---|---|---|---|---|---|---|
| Q India Value Equity Composite | 15.1% | 12.5% | 9.6% | 8.5% | 9.0% | -2.3% | -6.3% | -6.2% | -4.5% |
| Benchmark * | 13.3% | 13.8% | 11.4% | 11.8% | 12.9% | 1.2% | -8.9% | -9.2% | -4.9% |
| Fund / Benchmark | Since Inception (Annualized) | 10 Years (Annualized) | 7 Years (Annualized) | 5 Years (Annualized) | 3 Years (Annualized) | 1 Year | 6 Months | 3 Months | 1 Month |
|---|---|---|---|---|---|---|---|---|---|
| Q India Value Equity Composite | 12.2% | 8.6% | 6.2% | 4.2% | 4.1% | -8.0% | -11.8% | -10.0% | -6.1% |
| Benchmark * | 10.4% | 9.9% | 8.1% | 7.4% | 7.9% | -4.8% | -14.2% | -12.8% | -6.5% |
* As of 1 January 2008, the firm changed the benchmark for the Q India Value Equity Composite from the S&P BSE 30 to the S&P BSE 200. When the benchmark was changed on that date, the Total Return Index values for the S&P BSE 200 were not available on Bloomberg (the firms data source). Subsequently, Bloomberg began publishing index values for the S&P BSE 200 Total Return Index in February 2014. As the Total Return Index values are available now, the firm believes it to be the best practice to report the total return of the benchmark instead of the price returns. The benchmark returns for the Since Inception period consists of the returns of the BSE 30 Total Return Index from inception through December 2007 linked geometrically with the returns of the S&P BSE 200 Total Return Index from January 2008 till date.
Disclosure Statements
Composite inception date is taken as the date on which the Portfolio Account is funded by the Client and accrual of Management fees commences.
Brief note on performance computation methodology under SEBI guidelines
SEBI amended the regulatory framework for Portfolio Managers by notifying SEBI (Portfolio Managers) Regulations, 2020 and further issuing a circular no. SEBI/HO/IMD/DF1/CIR/P/2020/26 dated February 13, 2020, which came into force from October 01, 2020. Under these, SEBI has prescribed specific guidelines on computation and disclosure of performance by portfolio managers to their clients and in marketing materials. A summary of these guidelines is given below.The performance of a discretionary portfolio management mandate shall be calculated using Time Weighted Rate of Return (“TWRR”) method.
Cash holdings and investments in cash equivalent are considered for calculation of performance.
Performance computed and reported shall be net of all fees and all expenses (including taxes/statutory levies thereon).
Statutory Disclosures
The performance reported above is not verified by SEBI.
Quantum Advisors provides a direct on-boarding option to clients who wish to avail our services, without intermediation of persons engaged in distribution services.
For detailed description of Q India Value Equity Strategy such as investment objective, assets allocation pattern, investment strategy and philosophy, associated risk factors and other details please refer to the Disclosure Document available at
UK related important disclosures
The content of this presentation has not been approved by an authorised person within the meaning of the Financial Services and Markets Act 2000 (“FSMA 2000”). Reliance on this presentation for the purpose of engaging in any investment activity may expose you to a significant risk of losing all of the property or other assets you invest or of incurring additional liability. This prsentation is exempt from section 21 FSMA 2000 on the grounds that it is directed only to certified sophisticated investors, high net worth companies, unincorporated associations, trusts and/or investment professionals within the meaning of the Financial Services and Markets Act 2000 (Financial Promotion) Order 2005 (“FPO”). The investment activity described in this presentaton is only available to these persons or entities and no other person or entity should rely on the contents of this document. The protections conferred by or under the Financial Services and Markets Act (FSMA) will not apply to this presentation and any investment activity that may be engaged in as a result of this presenation. The applicability of any dispute resolution scheme or compensation scheme and its jurisdiction (if and where applicable) pertaining to a transaction resulting from this presentation would be as specified in the respective client agreements.
Related Post
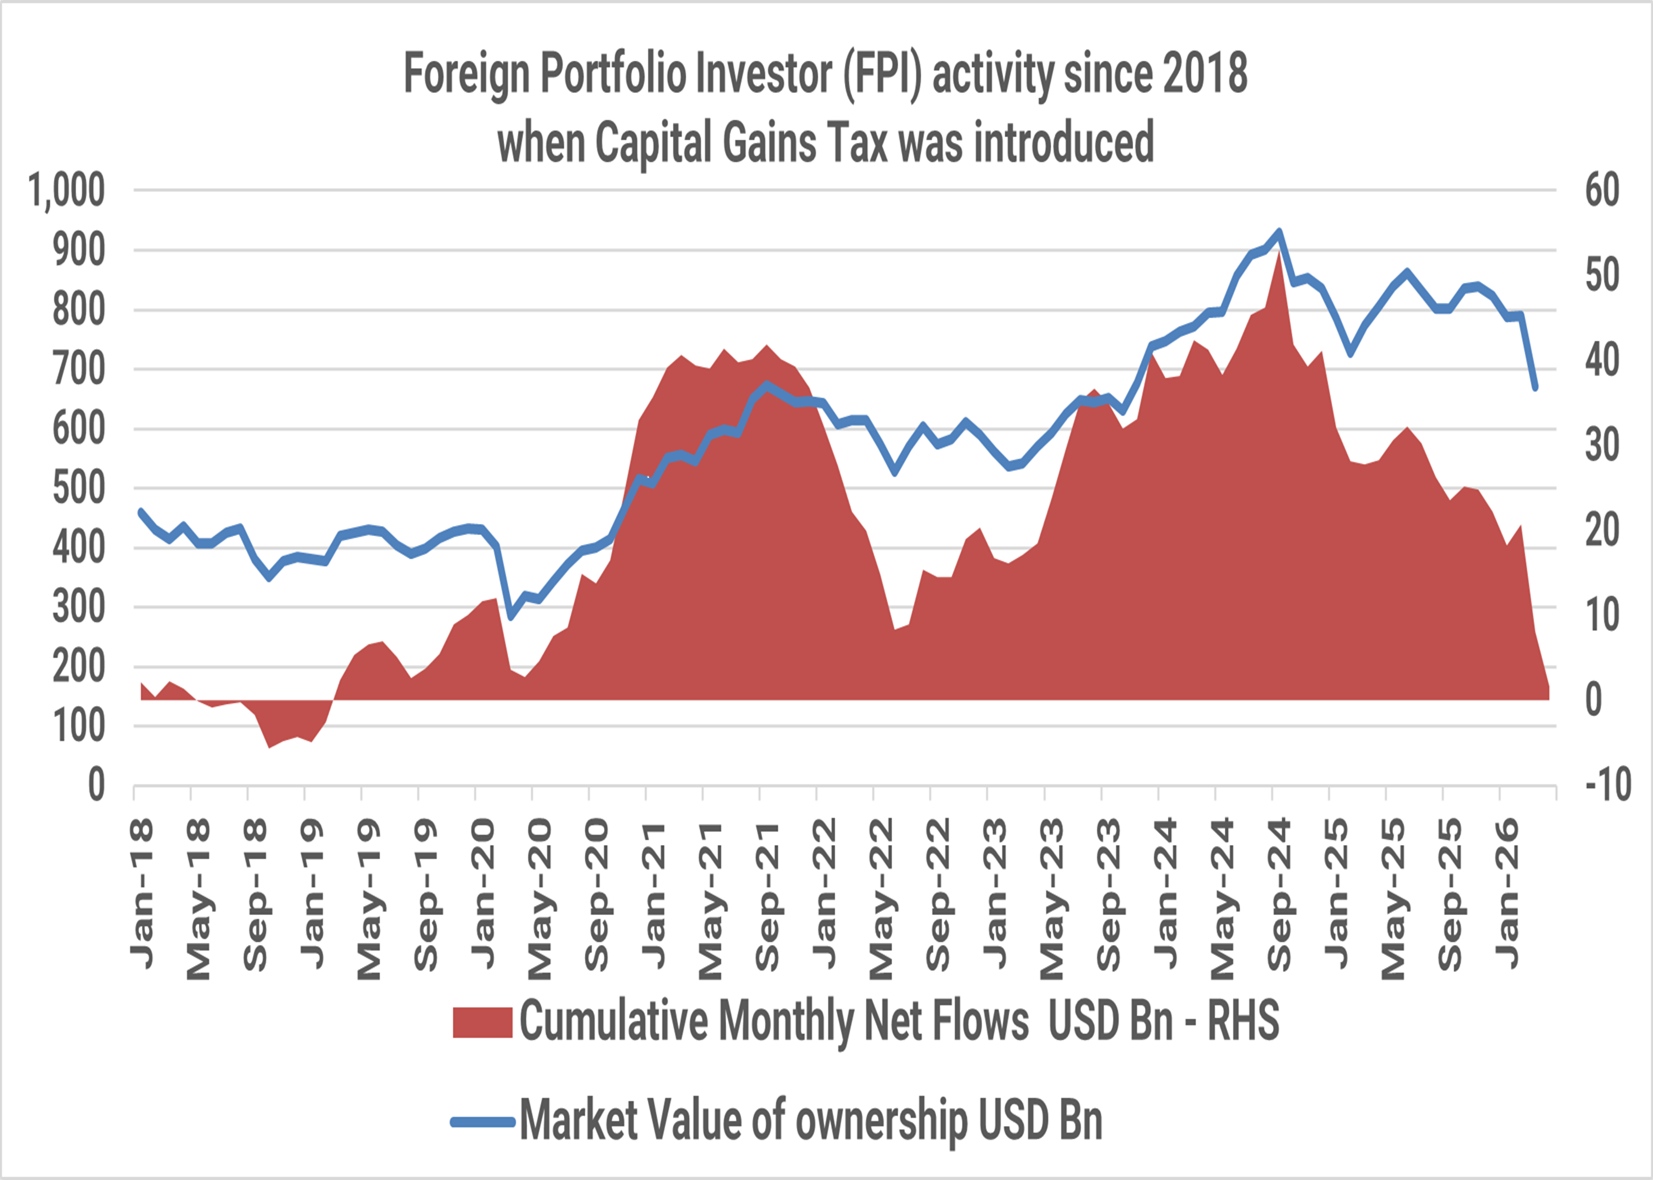
India: T I N A to A N T I
The Indian public equity markets peaked in September 2024. Since then, foreign investors have sold USD 51 billion till April 2026. The market value of foreign investor holding in Indian equities has fallen from USD 930 billion in September 2024 to USD 670 billion, a ~30% drop as at the end of March 2026.

India Investing: From a complicated 2025 to a Simpler 2026?
The simple India investing story of double-digit nominal GDP growth reflecting in stock market returns even in dollar terms has faced some headwinds in 2024/2025. Are these headwinds structural? What should investors expect in 2026?
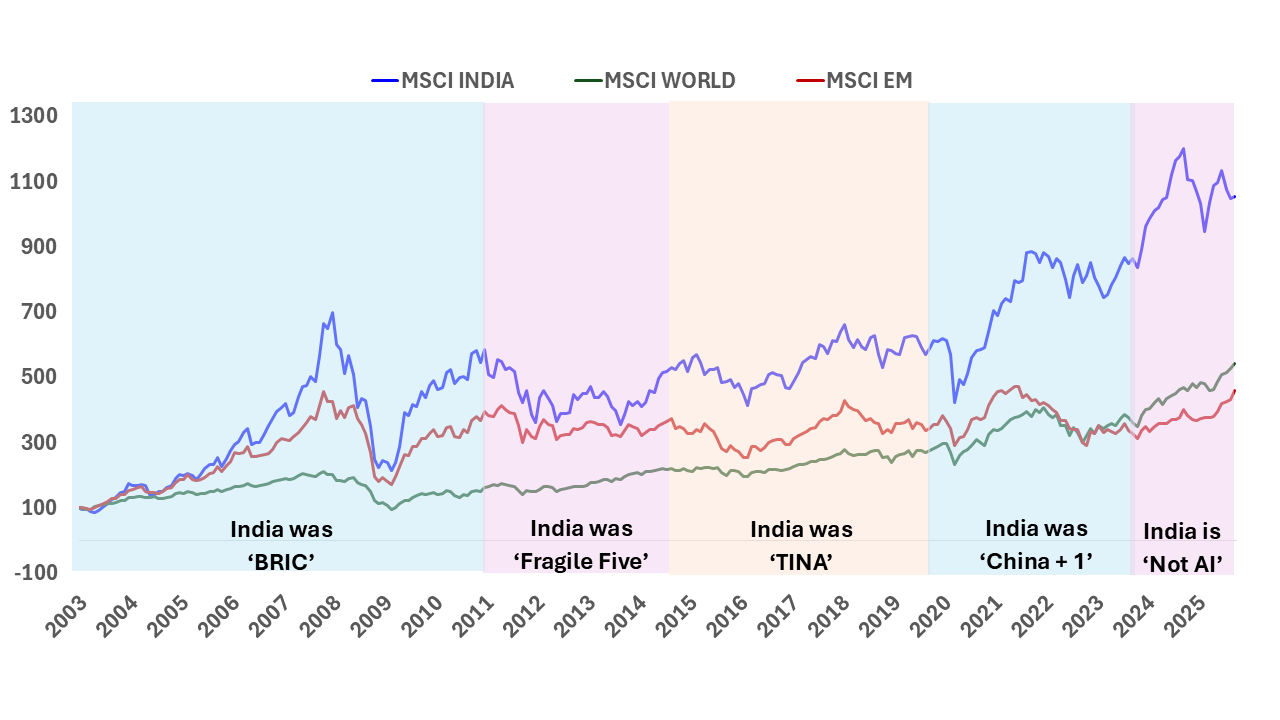
India Investing Under Global Mood Swings
The narrative around global investing is often built around stories. Investors weave these stories around cycles, themes, and opportunities to justify and support their investment rationale.
Our Strategies
Explore how our two main strategies – Predictable India Equity and India Integrity Equity - with demonstrated success of our tried and tested research and investment processes can ensure your India equity allocation will have higher predictable outcomes and no surprises.
Q India Value Equity Strategy
20+ years of India Long-only, Liquid, High-Governance, Margin of safety = Predictability
Integrity screen since 1996, strategy Track record since 2000.
Q India Responsible Returns Strategy
Liquid, proprietary Integrity Scores, Financial Soundness
Integrity Screen since 1996, enhanced criterion since 2015, strategy Track Record since 2019; strategy AuM: $9.7 mn Mandate Capacity: $5 billion
Quantum Advisors pioneered a quantitative as well as qualitative analytical approach to equity investing in India, providing for the first time, consistently applied valuation metrics to evaluate investment opportunities in India’s emerging stock markets. Over the years, Quantum Advisors has continued and enhanced its tradition of extensive financial analysis and value investing, as it has evolved into an investment advisor and asset manager.
Our investment philosophy and strategy involves the use of intensive qualitative and quantitative fundamental analysis. We build and monitor our clients’ portfolios actively while at the same time avoiding excessive trading, and control risk by endeavoring to keep our clients’ portfolio adequately diversified, both in terms of the sectors included in those portfolios, as well as with respect to the level of concentration in any specific security.