


India Investing: From a complicated 2025 to a Simpler 2026?
The simple India investing story of double-digit nominal GDP growth reflecting in stock market returns even in dollar terms has faced some headwinds in 2024/2025. Are these headwinds structural? What should investors expect in 2026?
The "Simple and Predictable Story" of long-term India Investing
It is a story of 6-7% real GDP growth which results in double-digit nominal GDP growth. Indian corporations convert the nominal macro growth to revenues and profitability, which is rewarded in the stock markets.
Table 1:Simple Story of India Investing
| % CAGR | 1 Year | 5 Year | 10 Year | 15 Year | 20 Year |
|---|---|---|---|---|---|
| Real GDP | 8.2 | 7.8 | 5.8 | 6.4 | 6.9 |
| Nominal GDP | 8.7 | 12.5 | 9.8 | 11.2 | 12.3 |
| EPS: BSE-500 Index | 9.6 | 20.1 | 11.8 | 10.0 | NA* |
| BSE-500 Index TR | -4.7 | 20.4 | 14.3 | 11.9 | 13.6 |
| QIVEC – Gross Returns | -4.0 | 21.6 | 14.4 | 13.2 | 15.8 |
| QIVEC – Net Returns | -5.2 | 20.1 | 13.3 | 12.1 | 14.6 |
Source: Bloomberg Finance L.P, Quarterly Data ending September 2025; 1 year is absolute returns; EPS= Trailing Earnings Per Share; (* the BSE indices EPS data show lot of volatile changes during the period 2004-2006 and hence not used due to data sanctity issues); TR=Total Returns includes Dividends, which averages ~1.5% annually); QIVEC = Q India Value Equity Composite, strategy returns calculated as per SEBI guidelines see full table returns with since inception data in annexures . Past performance does not guarantee future return.
This is why we call it “Predictable India”.
“India is Not AI”
In 2025, as India under-performed emerging markets and world indices, we heard about “India is the world’s anti-AI market’ or ‘India is an AI loser’1 to explain India’s current underperformance relative to China, Korea, Taiwan etc.
We made a simple point in our November newsletter that India has seen many such ‘mood-swings’. These mood swings, themes, and memes may have an impact on near-term expectations and outcomes. They are hence to be seen as tactical in nature.
India investing is however a simple, strategic, long-term allocation.(Read India Investing through global mood swings – and see chart 1 and 2 in this article)
Table 2:India underperforms over last 1 year, but outperforms over the long-term
| In USD | 1 Year | 5 Year | 10 Year | 20 Year | 25 Year |
|---|---|---|---|---|---|
| MSCI ACWI | 22.9% | 11.7% | 12.3% | 8.7% | 7.7% |
| MSCI EM | 34.4% | 4.7% | 8.9% | 6.4% | 8.9% |
| MSCI India | 4.3% | 10.8% | 10.2% | 8.7% | 11.0% |
| QIVEC-Gross | -0.10% | 12.80% | 10.50% | 11.90% | 15.10% |
| QIVEC-Net | -1.30% | 11.30% | 9.50% | 10.70% | 13.80% |
Source: Bloomberg Finance L.P, MSCI; Gross Returns in USD; ACWI=All country world index; EM=Emerging Market Index; Above 1-year returns are annualized, Returns as at December 2025; This is only for representation and understanding purpose and should not be construed as a recommendation to invest; QIVEC = Q India Value Equity Composite, strategy returns as per SEBI guidelines; see full table returns with since inception data in annexures. Past performance does not guarantee future return.
Table 1 is the link between GDP growth, earnings, and market returns in INR.
Table 2 is India’s relative performance against Emerging markets and world index in USD.
The long-term trend is clear.
However, both tables show the divergence in the last 1-year return.
The Nominal GDP and hence earnings growth has been muted and that reflects in market returns in INR.
The Indian rupee has fallen sharply in a year when the US dollar has been weak, thus further impacting reported US dollar returns relative to other countries.
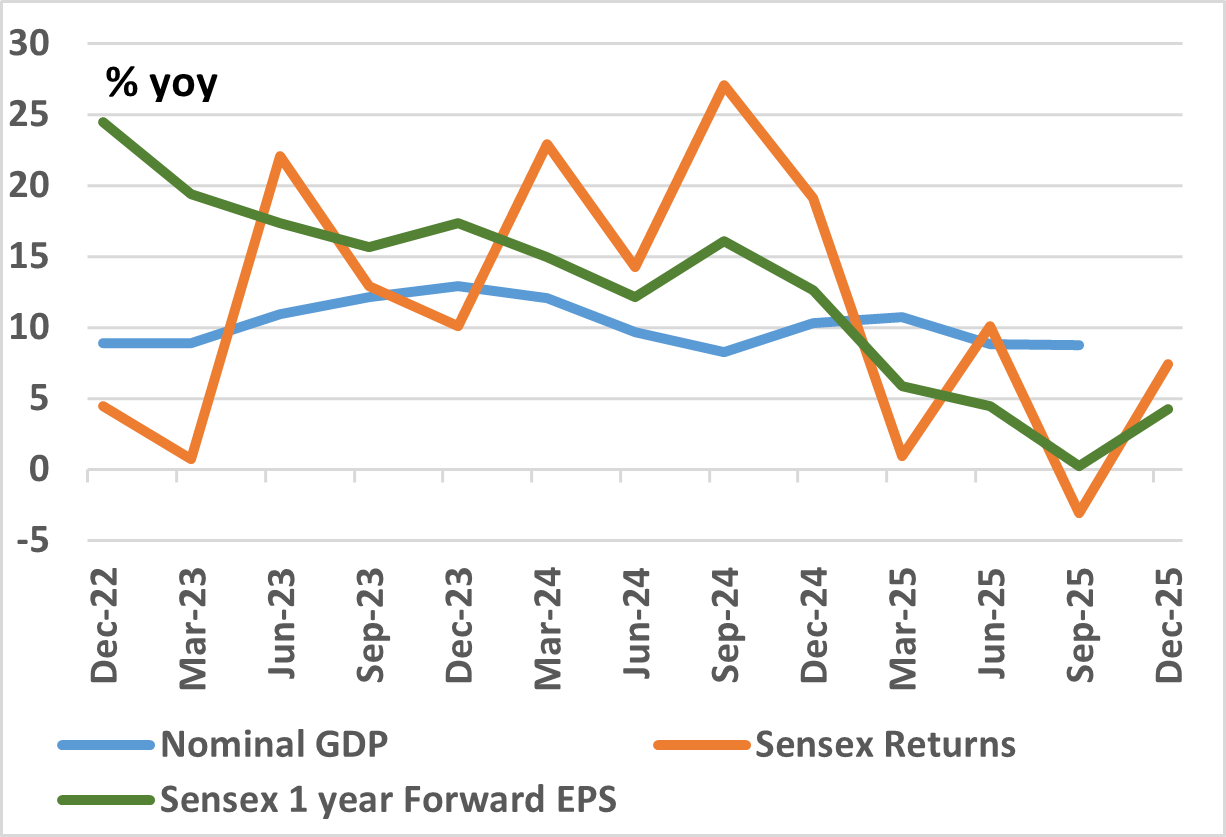
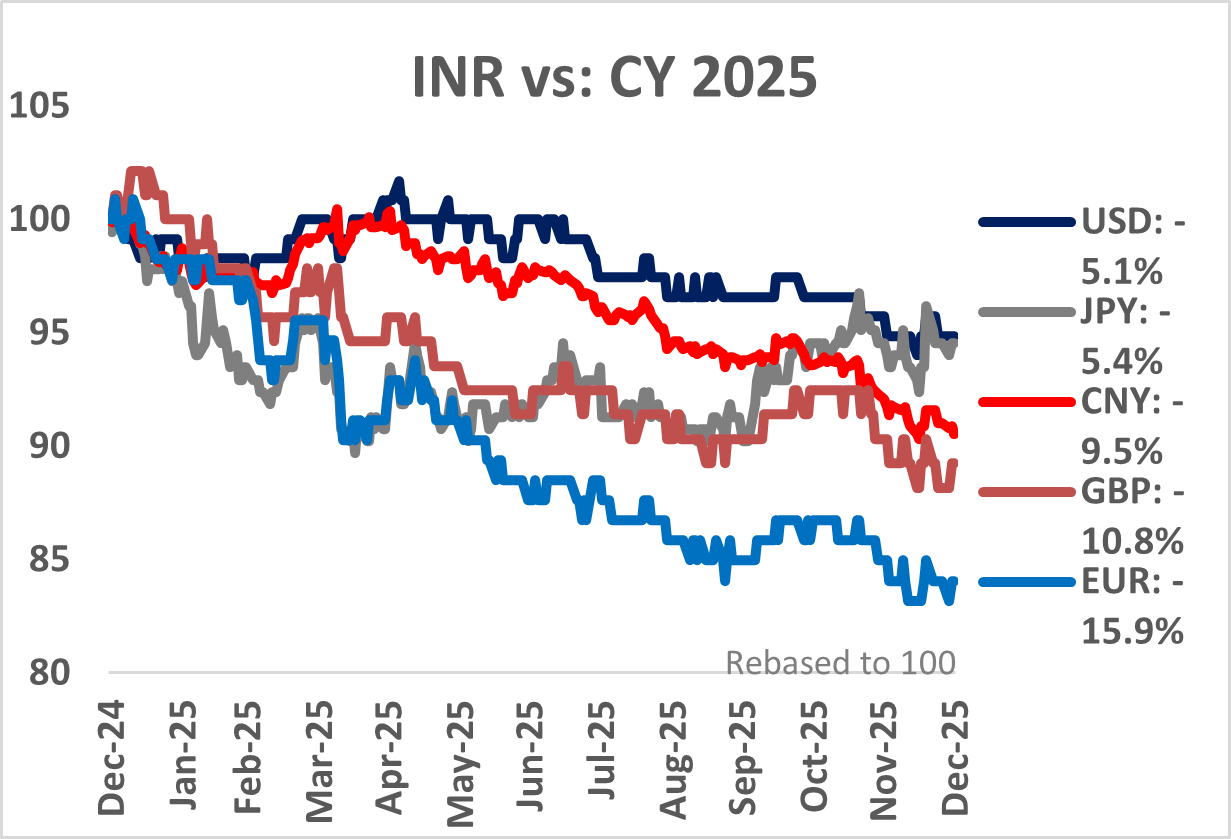
Chart 1:In 2025, Nominal Growth has been below average and Chart 2: INR depreciated by more than usual
Source:
(Data Source – Chart 1: Bloomberg Finance L.P; Quarterly %yoy GDP data as of September 2025, BSE-30 Sensex Index, EPS = 1 year forward Earnings Per Share – data till December 2025)
(Data Source – Chart 2: Refinitiv DataStream. Data from Jan 01, 2025 to December 31 2025; All lines are INR against the currency mentioned; numbers in legend show % change for the period; USD: US Dollar, JPY: Japanese Yen, CNY: Chinese Yuan, GBP: Great Britain Pound, EUR: Euro). There is no guarantee that the historical results are indicative of future results.
In 2025, Nominal Growth is below long-term average and the INR depreciated by more than usual.
We don’t believe it is structural. However, it is worth looking if the headwinds to our simple long-term India public market investing thesis can persist onto the coming years.
In our insight piece, why India does not grow at 8%, we noted that the drivers of high growth, (investment, exports, manufacturing, and external capital flows - see chart 2 in that article link;) peaked in 2012 and are slowly recovering to those levels. That is why we assume a 6.0% - 6.5% sustainable rate of real GDP growth.
Private corporate capex activity floundered in the last decade. However, we do see the private corporate investment cycle reviving. The statistical bump post COVID seems to be sustaining and should drive corporate and nominal growth higher from the current levels. This isn’t all that high, but we believe this could help sustain the 6.5% real GDP growth and double-digit nominal GDP growth along with supportive income growth.
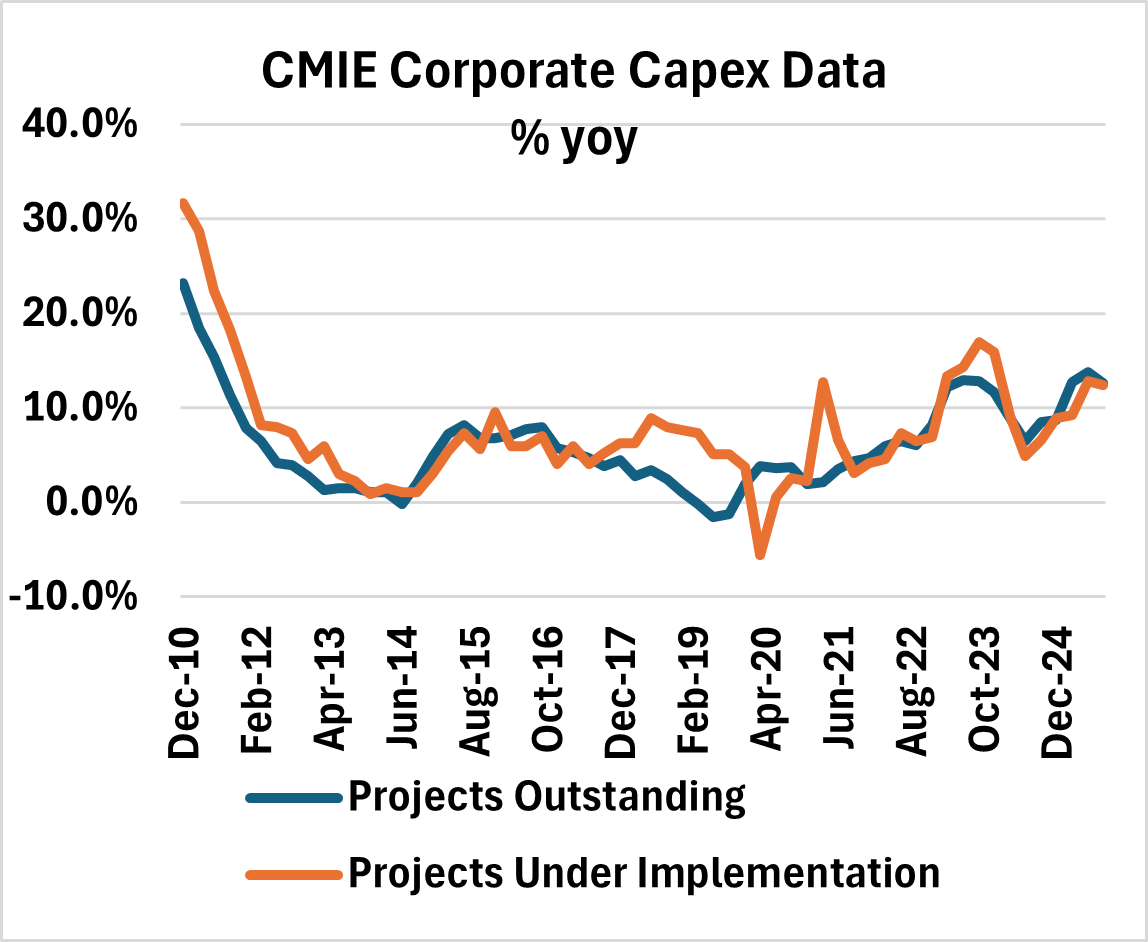
Chart 3 and 4: Corporate capex finally reviving, but will it sustain?
Source:
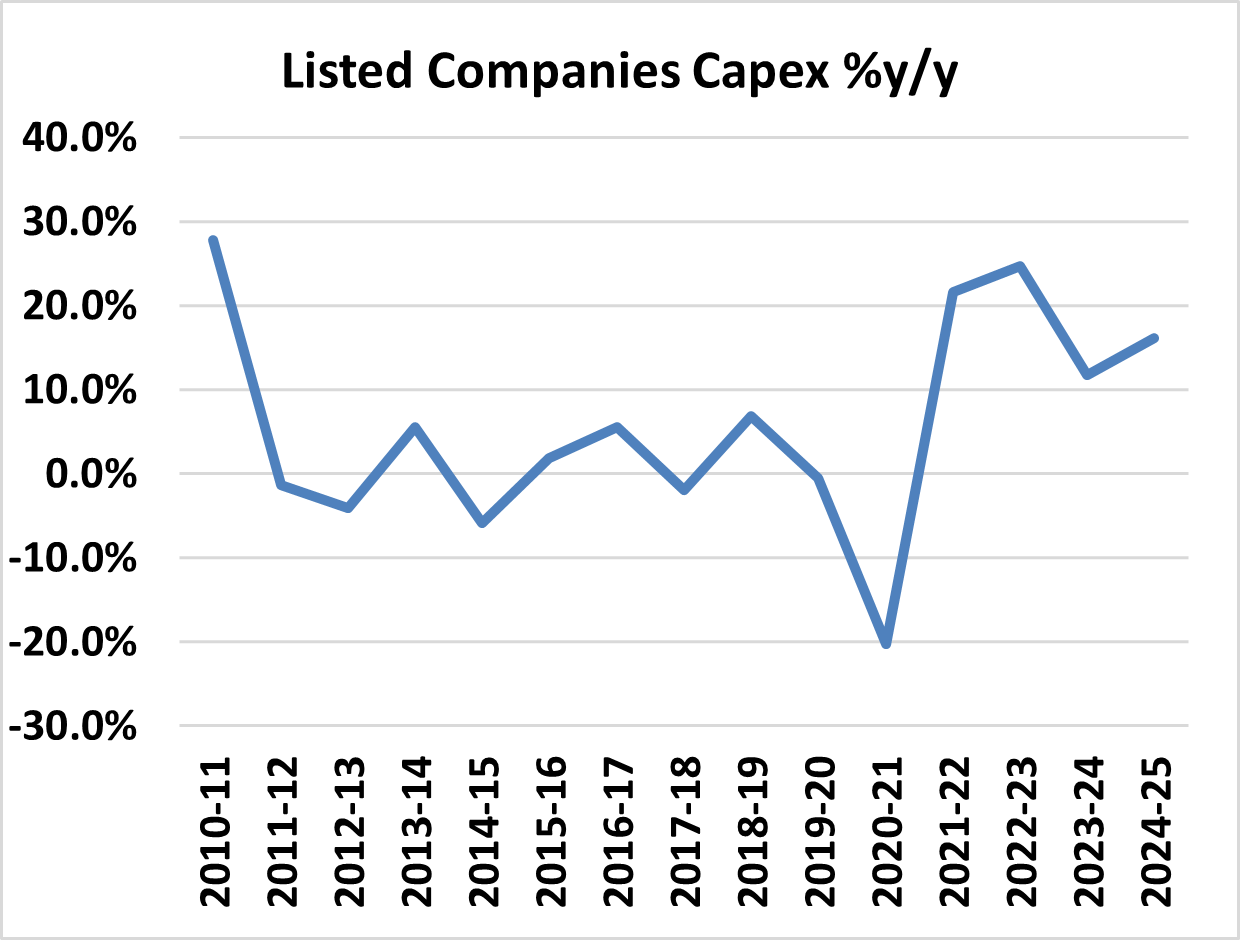
(Source: CMIE Economic Outlook; Corporate capex quarterly data till September 2025; Listed Companies capex from cash flow statement, Annual Data till March 2025)
We would though watch the following four broad points very closely. We believe this has impacted private capex in India
-
Lack of product R&D to meet with changed global exports: The global export market has changed a lot with electronics, memory/chips, EV and ready apparel driving growth and in our opinion, India does not have a major share of this growing market and hence export growth and associated capex has lagged.
-
India’s Production Linked Incentive scheme (PLI) for electronics, chips, consumer durables seem to be developing a domestic ecosystem. Apple’s success in India with the use of PLI provided to its component ecosystem is proving to be a big test case 3
-
-
Lower domestic demand due to slower income growth: Household income growth has lagged since the economic disaster of demonetization in 2016 and further impacted by COVID. The impact is visible in consumer sector volume growth.4
-
Indian politicians have realized the political impact of lower incomes and Indian state governments have announced cash transfer for women worth almost 1% of GDP over the last 1 year 4
-
Gold prices rising has a second order wealth effect in India given the large domestic ownership 5
-
-
Protectionism, rent seeking, lack of competition: India had increased import duties, used Quality control orders (QCO) and strategic interests to protect domestic industries from competition. The lack of competition eventually reduces overall aggregate investments.
-
The reduction in certain import duties and the removal of QCOs in certain industries suggest that government has realized its impact on broader manufacturing ecosystem 6 (We should maybe thank Donald Trump and his trade policies for forcing India to do this!)
-
-
Concentrated crony capitalism: We flagged this risk before the 2024 elections as well. In many sectors in India today, market competition is being reduced by actively supporting few large industrial groups to the detriment of attracting capital from other Indian businesses or global corporations 7
-
We hoped that the formation of a coalition government would mean that many more ‘cronies’ of other political parties would also be handed out favors.
-
India is struggling to attract large capital flows
The impact of slower income growth and reduced corporate capex activity also has its impact on capital flows. For its size and hype, India gets far little capital flows than warranted. And when foreign investors exit / book profits, it then has an impact on the currency.
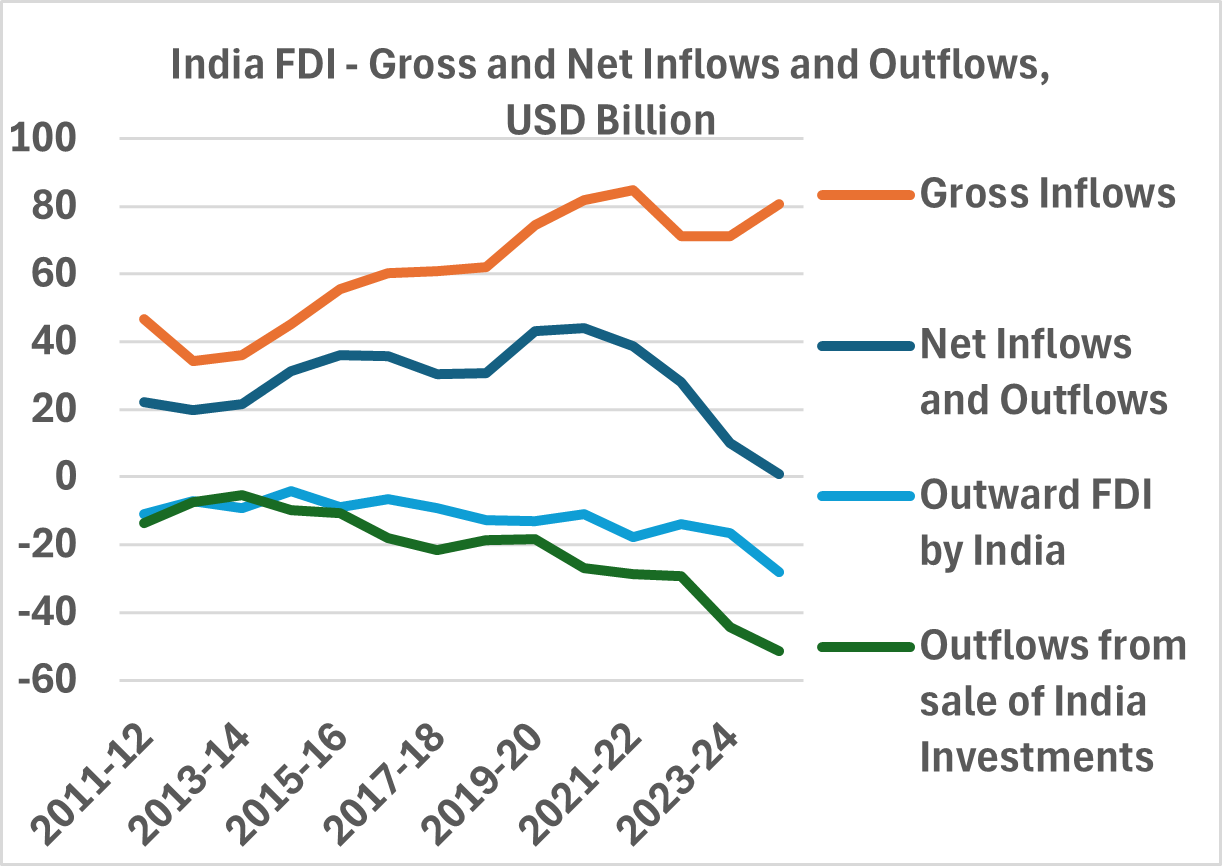
Chart 5 and 6: Are Foreign Investors exiting India?
Source:
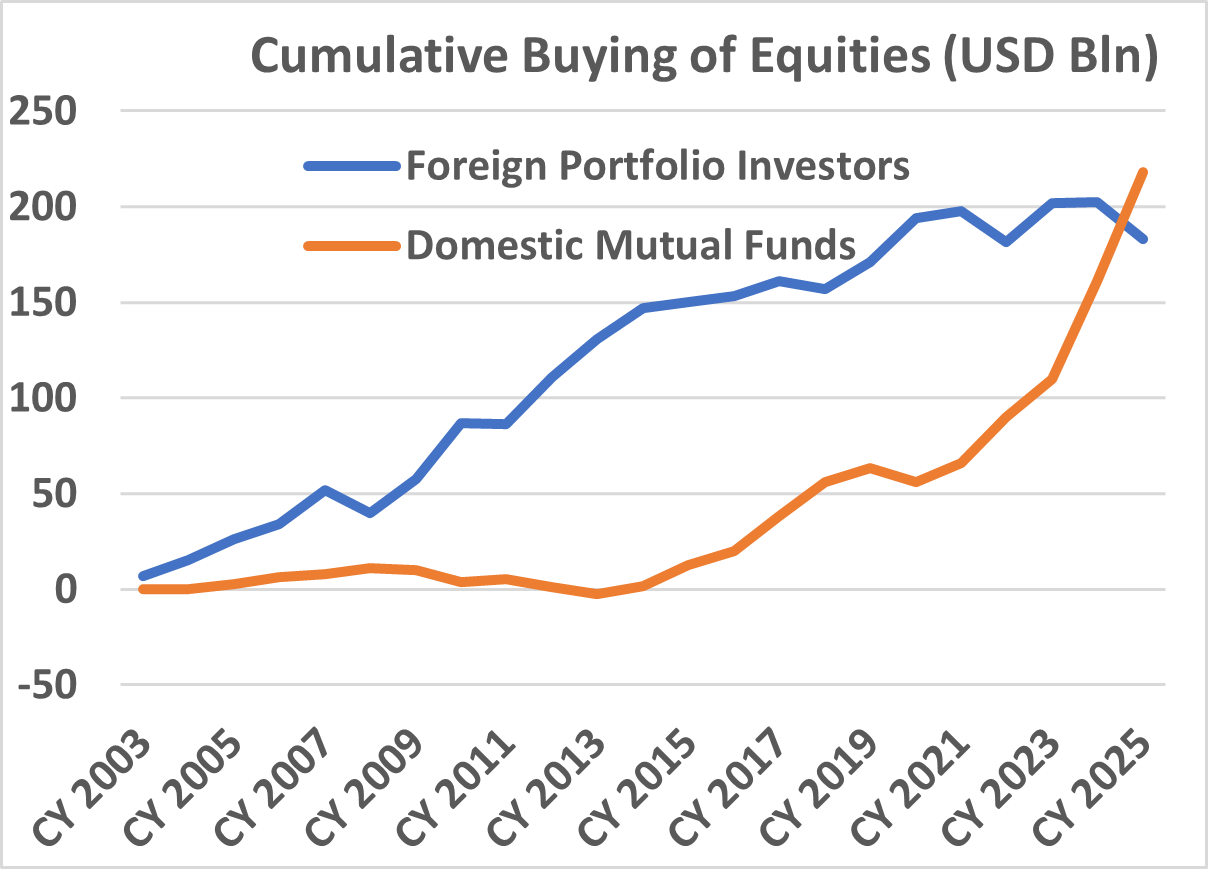
(Source for Chart 5: CMIE, RBI, Annual Data till March 2025) (Source for Chart 6: NSDL FPI Monitor, SEBI, Calendar Year Data till December 2025)
If you look at the FDI chart, India does get annual gross FDI flows of ~USD 80 billion. However, only ~USD 45 billion is new investments, the rest is reinvested capital by existing companies. Of that, we estimate that a very low proportion is from global multi-national corporations (MNCs) 8. Most of the investments are from global financial investors in Private Equity (PE), Venture Capital (VC), Infrastructure and Real Estate (RE).9
It is good to see those flows; however financial investors also need exits. The dark green line in chart 5 is that. Exits by financial investors through public market or private sales. This is a good sign as India has been a big distributor of capital in what seems to have been a tough period for private market exits. However, in a tough year for capital flows, exits of that order leaves overall capital flows negative.
Especially given the fact that even portfolio investors have also been relentless sellers. The blue cumulative line in chart 6 is flat and falling since 2020. Given India’s relative outperformance within emerging markets till 2024, we believe a large proportion of the FPI selling should be seen as profit booking. But the narrative of ‘India is not AI’, the slower growth, higher valuations and capital gains tax are major impediments in attracting fresh foreign capital. It is domestic capital flows which has protected market returns.
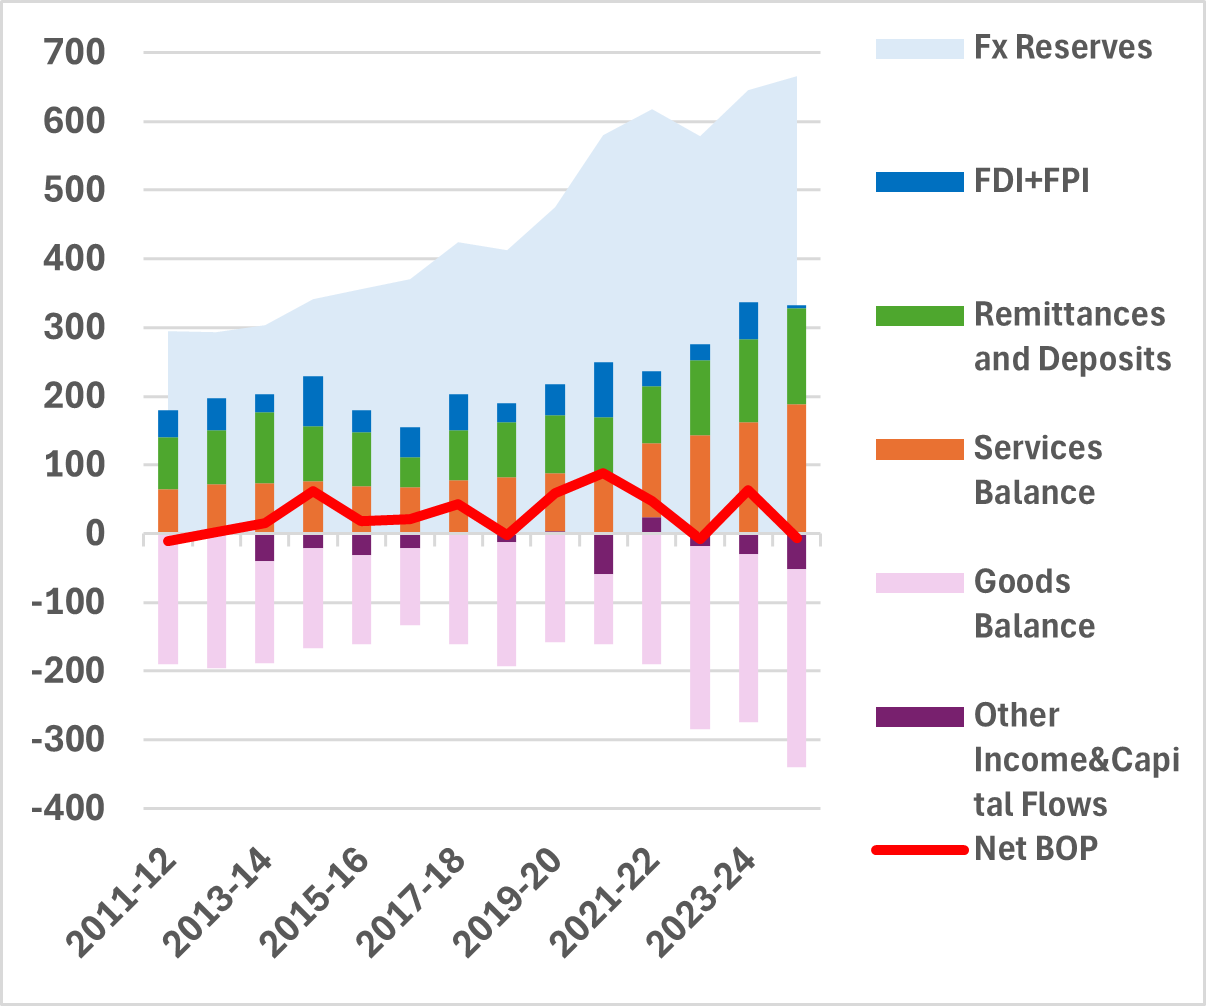
Chart 7 and 8: India sees net capital outflows and INR depreciates more than warranted
Source:
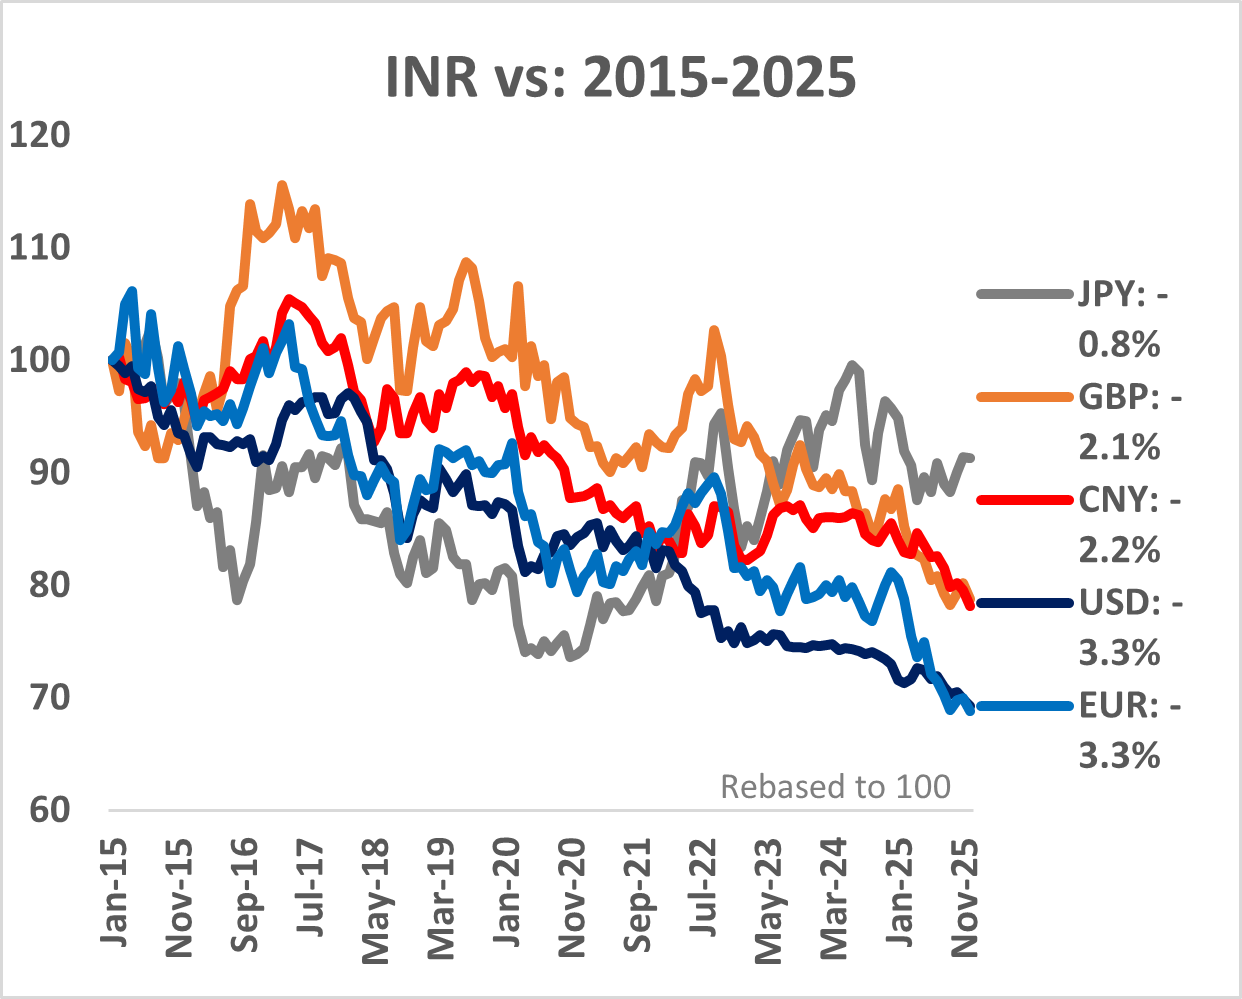
(Source for Chart 7: RBI, Annual Data till March 2025, Data is USD Billion, BOP=Balance of Payment) (Source for Chart 8: Refinitiv DataStream. Data from Jan 01, 2015, to December 31, 2025; All lines are INR against the currency mentioned; USD: US Dollar, JPY: Japanese Yen, CNY: Chinese Yuan, GBP: Great Britain Pound, EUR: Euro); numbers in legend show % CAGR for the period.
AI effect: As chart 7 shows, the services trade balance (orange bar), predominantly IT services, is a big and growing dollar revenue generator for India. AI can impact this. We would yet believe that Indian IT services companies will implement enterprise AI at scale. Also, India continues to see large global capability centres (GCC) being set up softening the potential blow to Indian IT services firms. 10
Trump Effect An added pressure has been India’s bewildering change of relationship with the US especially post the India-Pakistan conflict. India has refused to credit US for their intervention and seems to be paying the price of being the highest tariffed country. 11
Despite, PM Modi’s recent overtures to Trump, there has been no reduction in the 25% extra penal rate for oil imports from Russia. Trump has recently remarked on news that India has reduced Russian Oil imports,“PM Modi wants to make me happy, He knows that I’m not happy and he is doing that to make me happy” 12
India’s largest private refiner also issued a statement on no new imports from Russia. A US senator remarked in the same interaction that punitive tariffs on India are having the desired impact and thus will push for the Russian Sanctions Act in the US congress which can potentially tariff countries buying Russian oil and uranium by a bigger amount. 12
The relationship with Donald Trump remains fickle and uncertain. With no trade deal in sight yet and no reduction in India’s tariff rates, the impact on external trade remains concerning. Although, exports have not been impacted all that much, but the overall capital flow and India investing sentiment has surely taken a hit. 13 The INR has thus depreciated by more than its usual pace. We have always guided for the INR to depreciate against the US dollar by 2-3% per annum. We ask investors to build this rate of depreciation in their India investment expectation. As chart 8 shows, at 3.3%, the pace has been a bit higher than guided.
On a relative fair valuation basis, given the large nominal depreciation, overall dollar weakness and India’s contained inflation and deficits, we think INR is already undervalued. 14
However, we have seen when sentiment sours, the INR can remain under-valued. We are inclined to guide for a higher annual depreciation over the coming year.
The double-digit nominal growth may well be restored this year. Earnings growth for the coming fiscal year March 2027 is expected in double digits. India’s relative under-performance has resulted in valuation comfort improving in the large cap space.15
The Q India Value Equity Portfolio team had increased the India allocation recommendation to 75%-100% of a client’s intended allocation based on the strategy’s Upside Potential. (For context, this recommendation was 25-50% in September 2024). We should expect foreign inflows to improve if the overall sentiment towards India improves.
We believe Indian policy makers, politicians and the government need to take a hard look on certain structural aspects of growth, investment, sentiment, foreign investor interest, tax policy on capital gains and dividends, rule of law, competitive intensity etc to attract long-term capital to boost growth, employment and incomes.
The simple and predictable India story can continue for the next decade, but it cannot be taken for granted.
Sources and Footnotes
-
HSBC Calls India World’s Anti-AI Market, Article in Financial Express, October 2025
-
World International Trade Data and Statistics (WITS)
-
PLI scheme powering India’s industrial renaissance – PIB, August 2025
-
Cash transfers to women have gone from 1 state to 15 states in 5 years – Article in Times of India, December 2025
-
$5 trillion in Household Gold Wealth – Article in Economic Times, December 2025
-
Rethinking QCOs – Article in Swarajya Magazine, November 2025
-
Crony Capitalism shrinks market liberalisation – East Asia Forum, November 2023
-
The FDI Exit Story – Article in the Financial Express, July 2025
-
IVCA FactBook
-
GCCs leading India’s growth journey – PIB, December 2025
-
How India-US relations unravelled – Lowy Institute, August 2025
-
Trump says Modi unhappy over tariffs – Bloomberg, December 2025
-
India exporters redirect shipments to Asia, Europe – Firstpost, November 2025
-
India’s Rupee undervaluation to lure global funds – Bloomberg, December 2025
-
Earnings to drive markets, large caps in focus – Article in CNBC, December 2025
Important Disclosures & Disclaimers
Quantum Advisors Private Limited (QAPL) is registered in India and holds a Portfolio Management License from Securities and Exchange Board of India (SEBI), Indiavide registration number INP000000187. It is also registered with the Securities and Exchange Commission, USA as an Investment Adviser and a Restricted Portfolio Manager with the Canadian Provinces of British Columbia (BCSC), Ontario (OSC), and Quebec (AMF). It is not registered with any other regulator. (Note- Registration with the above regulators does not imply any level of skill or training).
Q India Value Equity Strategy - Composite (Composite) is an aggregation of Client portfolios with a similar investment mandate and with no cash restrictions that are managed or advised by Quantum Advisors on a discretionary basis using the long only value equity strategy. The Composite does not include all client portfolios due to various client-imposed portfolio restrictions, even though all portfolios in this broad mandate are managed using the same strategy. The Composite represents 0.05% of the total AUM under the Q India Value Equity Strategy as on December 31, 2025.
Composite Gross return stated above are the returns achieved before the deduction of all fees and expenses except trading cost. Composite’s Net returns are computed net of fees and expenses. Returns stated above are assuming reinvestment of all dividend and other earnings. Returns from cash and cash equivalents held in portfolios are included in the return calculations.
The various constituents of the Composite pay different management fees. The net-of-fee and expense returns of the Composite indicated in tables in this newsletter reflect the weighted average management fees paid to Quantum Advisors Pvt Ltd (QAPL) by the different constituents of the Composite.
The return shown in graph in this document are calculated using Time Weighted Rate of Return (“TWRR”) method.
The firm has formulated an internal policy and procedures on inclusion, exclusion of the portfolio accounts and factoring significant cash flows for computing the performance of Composite which will be available upon request. Please note that the performance of individual client portfolio may vary from that of other investors and that generated by the Composite across all investors because of (1) the timing of inflows and outflows of funds; (2) difference in the portfolio composition because of restrictions and other constraint; and (3) difference in fees and expenses charged to each of the client accounts.
Annexure - 1
Performance of the Q India Value Equity Strategy (Composite) (QIVEC) computed as per methodology prescribed under SEBI guidelines
| (% change in INR) | Since Inception (Annualized) | 10 Years (Annualized) | 7 Years (Annualized) | 5 Years (Annualized) | 3 Years (Annualized) | 1 Year | 6 Months | 3 Months | 1 Month |
|---|---|---|---|---|---|---|---|---|---|
| QIVEC (Net) | 15.6% | 13.3% | 13.0% | 20.1% | 17.3% | -5.2% | 4.2% | -3.3% | -0.4% |
| Benchmark- BSE 500 | 14.3% | 14.4% | 15.2% | 20.7% | 16.1% | -5.5% | 7.2% | -3.2% | 1.2% |
| (% change in USD) | Since Inception (Annualized) | 10 Years (Annualized) | 7 Years (Annualized) | 5 Years (Annualized) | 3 Years (Annualized) | 1 Year | 6 Months | 3 Months | 1 Month |
|---|---|---|---|---|---|---|---|---|---|
| QIVEC (Net) | 12.5% | 9.9% | 9.7% | 15.6% | 13.9% | -10.6% | 0.3% | -6.6% | -1.1% |
| Benchmark- BSE 500 | 11.3% | 11.0% | 11.9% | 16.3% | 12.8% | -10.8% | 3.2% | -6.5% | 0.6% |
| In INR | Since Inception (Annualized) | 10 Years (Annualized) | 7 Years (Annualized) | 5 Years (Annualized) | 3 Years (Annualized) | 1 Year | 6 Months | 3 Months | 1 Month |
|---|---|---|---|---|---|---|---|---|---|
| QIVEC (Net) | 15.6% | 13.3% | 13.0% | 20.1% | 17.3% | -5.2% | 4.2% | -3.3% | -0.4% |
| Benchmark- BSE 500 | 14.3% | 14.4% | 15.2% | 20.7% | 16.1% | -5.5% | 7.2% | -3.2% | 1.2% |
| (% change in USD) | Since Inception (Annualized) | 10 Years (Annualized) | 7 Years (Annualized) | 5 Years (Annualized) | 3 Years (Annualized) | 1 Year | 6 Months | 3 Months | 1 Month |
|---|---|---|---|---|---|---|---|---|---|
| QIVEC (Net) | 12.5% | 9.9% | 9.7% | 15.6% | 13.9% | -10.6% | 0.3% | -6.6% | -1.1% |
| S&P BSE 500 (Benchmark) | 11.3% | 11.0% | 11.9% | 16.3% | 12.8% | -10.8% | 3.2% | -6.5% | 0.6% |
Inception Date: June 27, 2000; Source: Quantum Advisors and Bloomberg Finance LP; data as of December 31, 2025
Brief note on performance computation methodology under SEBI guidelines:
SEBI has prescribed specific guidelines on computation and disclosure of performance by portfolio managers to their clients and in marketing materials. A summary of these guidelines is given as below.
- The performance of a discretionary portfolio management mandate shall be calculated using Time Weighted Rate of Return (“TWRR”) method.
- Cash holdings and investments in cash equivalent are considered for calculation of performance.
- Performance computed and reported shall be net of all fees and all expenses (including taxes/statutory levies thereon).
The "Index" is a product of Asia Index Private Limited (AIPL), which is a wholly owned subsidiary BSE has been licensed for use by QAPL. BSE® is a registered trademark of BSE Limited (“BSE”) and these trademarks have been licensed for use by AIPL and sublicensed for certain purpose by QAPL. All rights reserved. Redistribution, reproduction and/or photocopying in whole or in part are prohibited without written permission of AIPL. For more information on any of AIPL’s indices please visit http://www.asiaindex.com/. None of AIPL, BSE, their affiliates nor their third party licensors make any representation or warranty, express or implied, as to the ability of any index to accurately represent the asset class or market sector that it purports to represent and none of AIPL, BSE or their affiliates nor their third party licensors shall have any liability for any errors, omissions, or interruptions of any index or the data included therein.
BSE 500 is a free-float-adjusted, market-cap-weighted index of 500 companies listed on the Bombay Stock Exchange.
BSE 500 comprises of stocks which are highly liquid (predominantly Large Cap) and broadly covers our investment universe under this investment strategy. Hence, we believe it makes a good benchmark as the portfolio has a bias towards highly liquid stocks. However, the Composite’s performance may not be strictly comparable with the performance of the Benchmark, due to inherent differences in the construction of the portfolios, and the volatility of the benchmark over any period may be materially different than that of the composite over the same period.
The firm sources benchmark-related data from Bloomberg.
Certain information contained herein (the “Information”) is sourced from/copyright of MSCI Inc., MSCI ESG Research LLC, or their affiliates (“MSCI”), or information providers (together the “MSCI Parties”) and may have been used to calculate scores, signals, or other indicators. The Information is for internal use only and may not be reproduced or disseminated in whole or part without prior written permission. The Information may not be used for, nor does it constitute, an offer to buy or sell, or a promotion or recommendation of, any security, financial instrument or product, trading strategy, or index, nor should it be taken as an indication or guarantee of any future performance. Some funds may be based on or linked to MSCI indexes, and MSCI may be compensated based on the fund’s assets under management or other measures. MSCI has established an information barrier between index research and certain Information. None of the Information in and of itself can be used to determine which securities to buy or sell or when to buy or sell them. The Information is provided “as is” and the user assumes the entire risk of any use it may make or permit to be made of the Information. No MSCI Party warrants or guarantees the originality, accuracy and/or completeness of the Information and each expressly disclaims all express or implied warranties. No MSCI Party shall have any liability for any errors or omissions in connection with any Information herein, or any liability for any direct, indirect, special, punitive, consequential or any other damages (including lost profits) even if notified of the possibility of such damages.
The returns of all the indices reported above are gross total returns.
Data of other indices is provided for information purposes only and to allow investors to compare the performance of the Composite to that of certain indices (many of which are well known and widely recognized). While we generally believe these comparisons provide meaningful and useful information to investors (for example, as a way of comparing an investment in the Composite to other types of investments that investors might make), inclusion of any particular index is not a representation that the index is an appropriate benchmark for evaluating the Composite’s performance. In particular, the volatility of indices over any period may be materially different from that of the Composite over that same period.
The views expressed herein shall constitute only the opinions and any information contained in this material shall not be deemed to constitute an advice or an offer to sell/purchase or as an invitation or solicitation to invest in any security and further Quantum Advisors Private Limited (QAPL) and its employees/directors shall not be liable for any direct or indirect loss, damage, liability whatsoever arising from the use of this information.
Information sourced from third parties cannot be guaranteed or was not independently verified. Whilst no action has been solicited based upon the information provided herein, due care has been taken to ensure that the facts are accurate, and the views given are fair and reasonable as on date. All the forward-looking statements made in this communication are inherently uncertain and we cannot assure the reader that the results or developments anticipated will be realized or even if realized, will have the expected consequences to or effects on, us or our business prospects, financial condition or results of operations.
Readers are cautioned not to place undue reliance on these forward-looking statements in making any investment decision. Forward-looking statements made in this communication apply only as of the date of this communication. While we may elect to update forward-looking statements from time to time, we specifically disclaim any obligation to do so, even if internal estimates change, unless otherwise required by applicable Securities laws.
This article is for educational and discussion purposes only and is not intended as an offer or solicitation for the purchase or sale of any investment in any jurisdiction. No advice is being offered nor recommendation given.
Recipients should exercise due care and caution and if necessary, obtain the professional advice prior to taking any decision based on this information.
Important Notice:
This newsletter contains hyperlinks to websites operated by third parties. These linked websites are not under the control of QAPL and are provided for your convenience only. Clicking on those links or enabling those connections may allow third parties to collect or share data about you. When you click on these links, we encourage you to read the privacy notice of the website you visit. QAPL does not endorse, or guarantee products, services or advice offered by these websites.
Our Strategies
Explore how our two main strategies – Predictable India Equity and India Integrity Equity - with demonstrated success of our tried and tested research and investment processes can ensure your India equity allocation will have higher predictable outcomes and no surprises.
Q India Value Equity Strategy
20+ years of India Long-only, Liquid, High-Governance, Margin of safety = Predictability
Integrity screen since 1996, strategy Track record since 2000.
Q India Responsible Returns Strategy
Liquid, proprietary Integrity Scores, Financial Soundness
Integrity Screen since 1996, enhanced criterion since 2015, strategy Track Record since 2019; strategy AuM: $9.7 mn Mandate Capacity: $5 billion
Quantum Advisors pioneered a quantitative as well as qualitative analytical approach to equity investing in India, providing for the first time, consistently applied valuation metrics to evaluate investment opportunities in India’s emerging stock markets. Over the years, Quantum Advisors has continued and enhanced its tradition of extensive financial analysis and value investing, as it has evolved into an investment advisor and asset manager.
Our investment philosophy and strategy involves the use of intensive qualitative and quantitative fundamental analysis. We build and monitor our clients’ portfolios actively while at the same time avoiding excessive trading, and control risk by endeavoring to keep our clients’ portfolio adequately diversified, both in terms of the sectors included in those portfolios, as well as with respect to the level of concentration in any specific security.