










India Investing:From ‘T I N A’ to ‘A N T I’
Quantum Advisors Private Limited (QAPL) is incorporated in India and is registered with the Securities and Exchange Board of India (SEBI) as Portfolio Manager vide registration number INP000000187.
Foreign Investor sentiment seems to have moved from ‘TINA’ - There Is No Alternative to being ANTI India
India Investing: ‘T I N A’ to ‘A N T I’
The Indian public equity markets peaked in September 2024. Since then, foreign investors have sold USD 51 billion till April 2026. The market value of foreign investor holding in Indian equities has fallen from USD 930 billion in September 2024 to USD 670 billion, a ~30% drop as at the end of March 2026.
Graph 1:Are Foreign Investors ‘ANTI’ India?
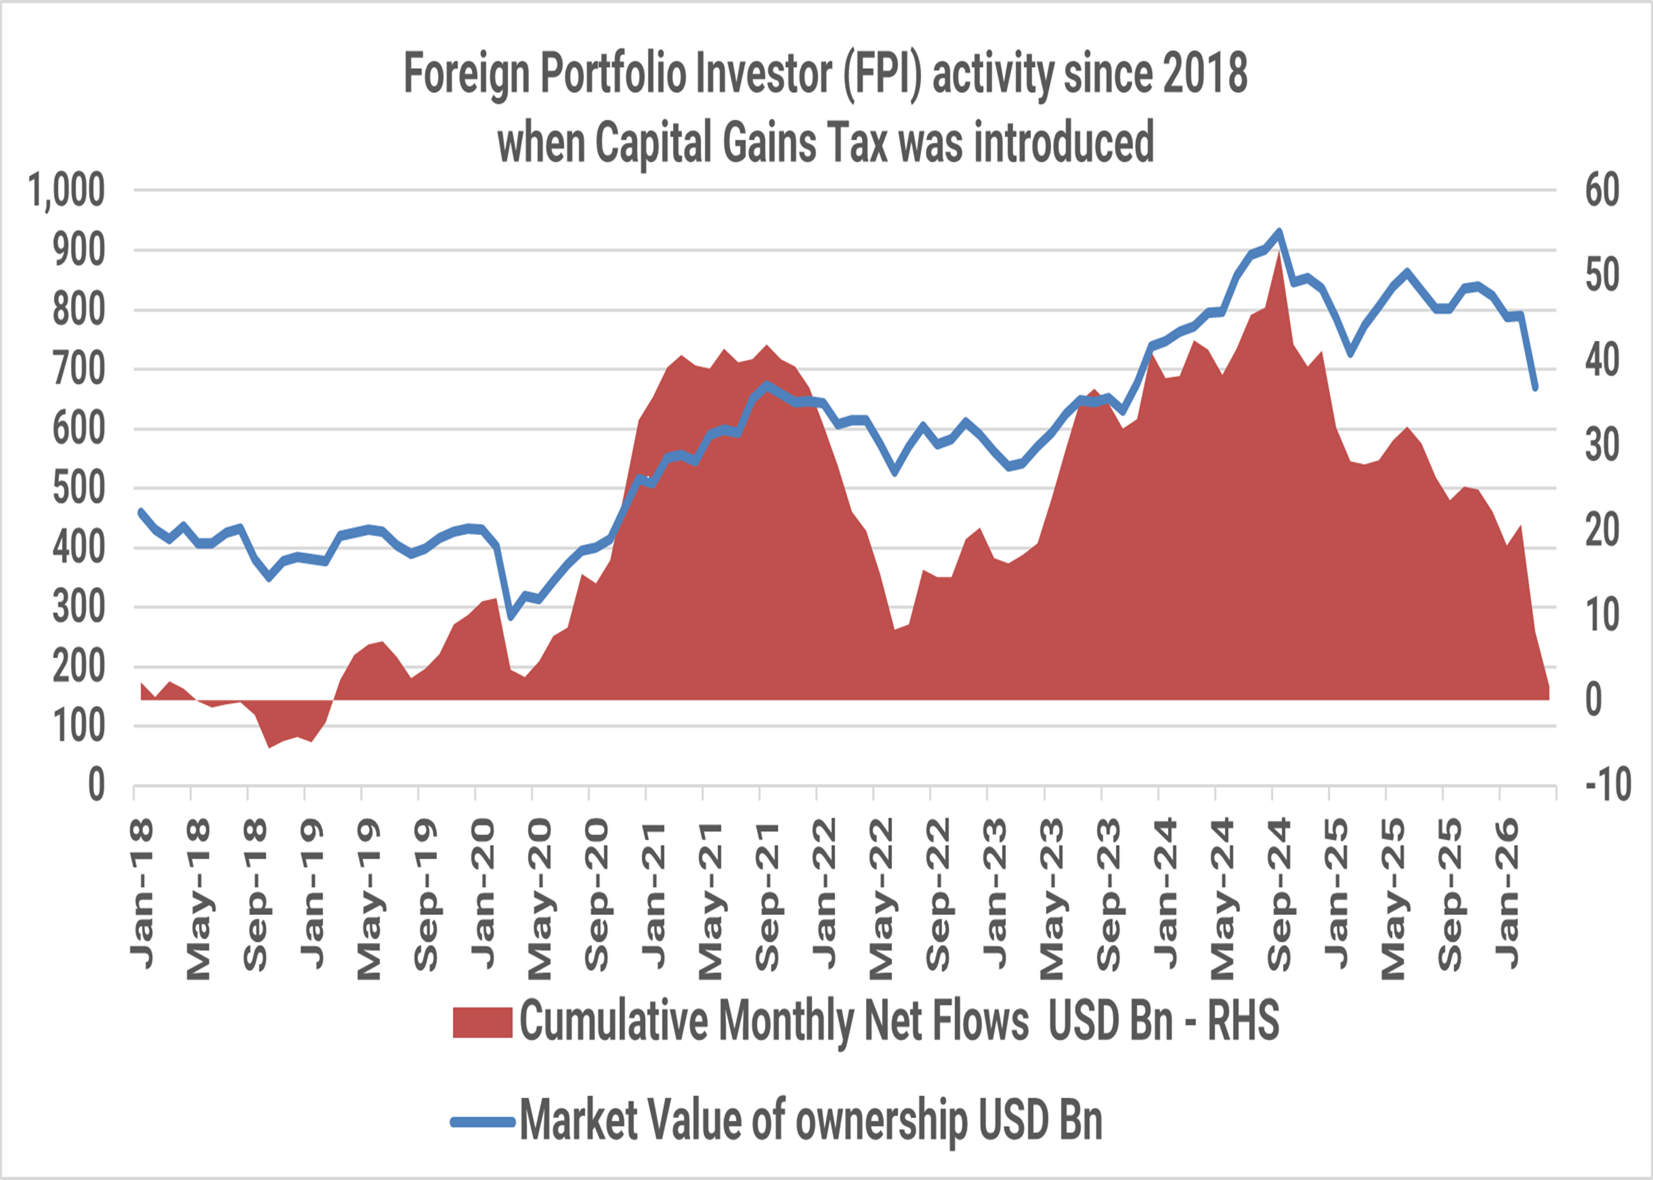
(Source: NSDL FPI Monitor, January 2018 to April 2026; Market Value of Ownership data till March 2026).
This historical data is only for representation and understanding purposes.
This seems to be a dramatic shift in sentiment towards India investing.
Within emerging markets, over the last 10 years, India was the favored investment destination. Many regarded India then as ‘TINA’ – There Is No Alternative (but to invest in India). 1
India was also hyped up as ‘China+1’. The ‘China+1’ theme found limited success in trade and manufacturing. However, India was a large beneficiary of the ‘China is uninvestable’ theme and saw large global capital inflows into private equity and venture capital.2
From there to a situation now where foreign investors seem ‘indifferent’ to the allure of the India markets.
Foreign investors seem to be ‘ANTI’ India given the pace of selling and exits from Indian markets.
Foreign ownership of the Indian equity markets is now down to its lowest level since 2012. India’s weight in the MSCI Emerging Markets and MSCI ACWI (All country world indices) has fallen by >30% since the peak of September 2024.3
Graph 2:India’s weight in global equity indices fall, India is even more under invested in global portfolios
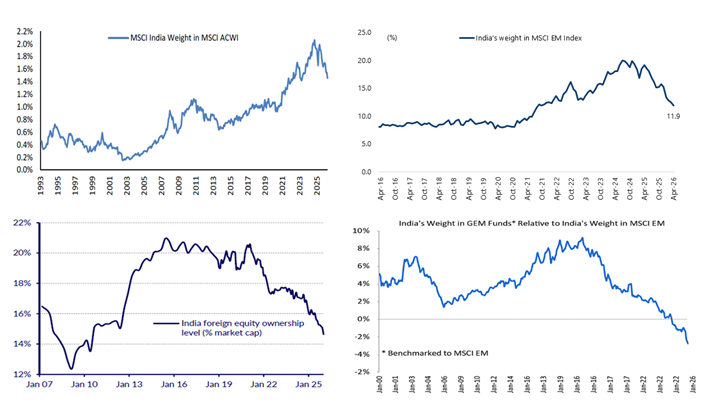
(Source for top left chart and bottom right: India’s weight in MSCI All country World Index (ACWI) and India’s weight in Global Emerging Market (GEM) Funds - Morgan Stanley Research, India Equity Strategy, April 2026)
(Source for top right chart: India’s weight in MSCI (Emerging Market) EM Index – Jefferies Research, April 2026)
(Source for bottom left: India Equity Ownership (% of marketcap) – CLSA Research, April 2026)
Past performance does not guarantee future return. This is only for representation and understanding purpose and should not be construed as a recommendation to invest.
A combination of weak currency, poor taxation structure on investments relative to other Emerging markets plus lack of AI play in India seem to have influenced foreign investor to sell India. 4
However, as we wrote in Simple Story getting Complicated , a large part of India’s relative underperformance can be explained by the fact that in recent times, India’s nominal GDP growth and earnings trajectory has been below its long-term average.
Graph 3:India’s simple story of double-digit nominal GDP and earnings growth got complicated
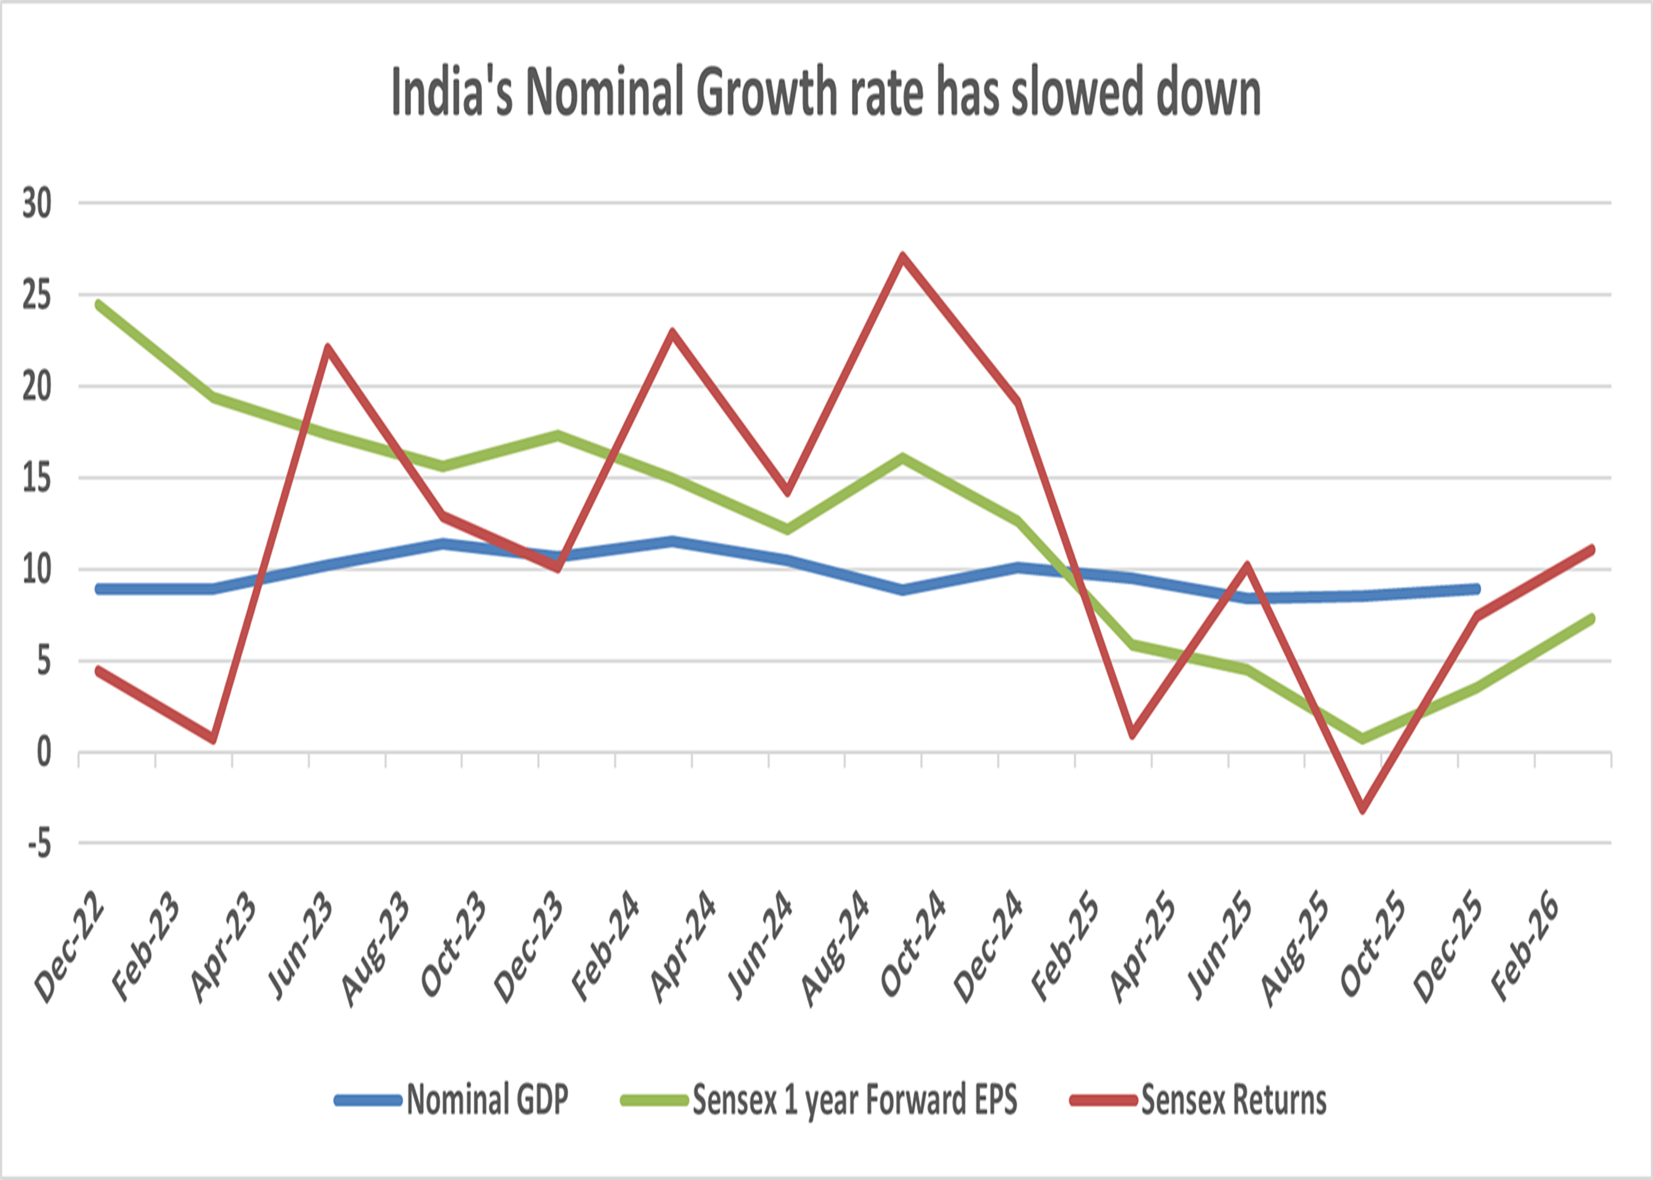
(Source: Bloomberg Finance L.P; Quarterly %yoy GDP data as of December 2025, BSE-30 Sensex Index, EPS = 1 year
forward Earnings Per Share- data till March 2026); Past performance is not indicative of future return
India Investing Story is a Growth Story
India commands a premium to Emerging markets predominantly due to its superior earnings profile and corporate return ratios. In the current cycle, that expectation is getting belied. Hence, we are witnessing a compression in the relative valuation of India over other emerging markets (see charts below). In our view, as India’s growth slows down and relative opportunities seem to be more promising, global investors who allocate to India from their global or emerging market funds seem to be taking capital away from India thus leading to capital outflows as shown above.
Is the Growth and Earnings Cycle changing?
Strong earnings, ahead of consensus expectations, are being reported by companies for March ended fiscal year 2026, especially those exposed to domestic consumption. However, the earnings reflected a limited pass-through of the escalating costs due to West Asia conflict and hence some managements have called out future input cost inflation due to rise in key commodity prices and supply chain disruptions in sectors such as autos, cement, agro-chemicals, and capital goods. The consensus earnings growth expectation of 16% for fiscal year ending March 2027 is therefore at risk.6
Graph 4:Robust trends in Sales and earnings growth
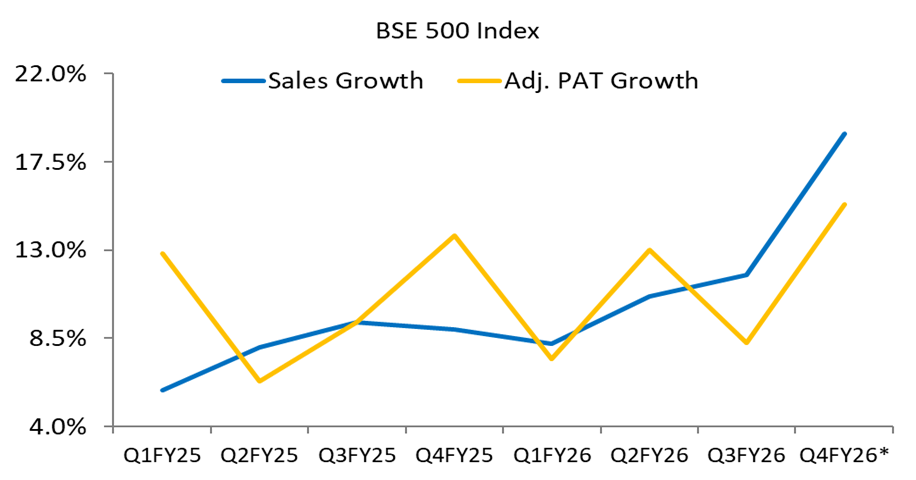
Source: Bloomberg, Capitaline; Note: BSE 500 data ex financials services, data for Q4FY26 based on results so far
for 147 companies as per data available at the time of making this chart. (PAT = Profit after Tax)
The graph is only for representation and understanding purpose and does not assure any promise or guarantee
that the historical results are indicative of future results.
India’s subdued market performance, its large under-performance to Emerging Market Index and the recent pick-up in earnings has resulted in India’s valuation in absolute and relative terms to trade at around its long-term average at somewhat attractive levels. 7
Graph 5: Index PE bouncing near long term average
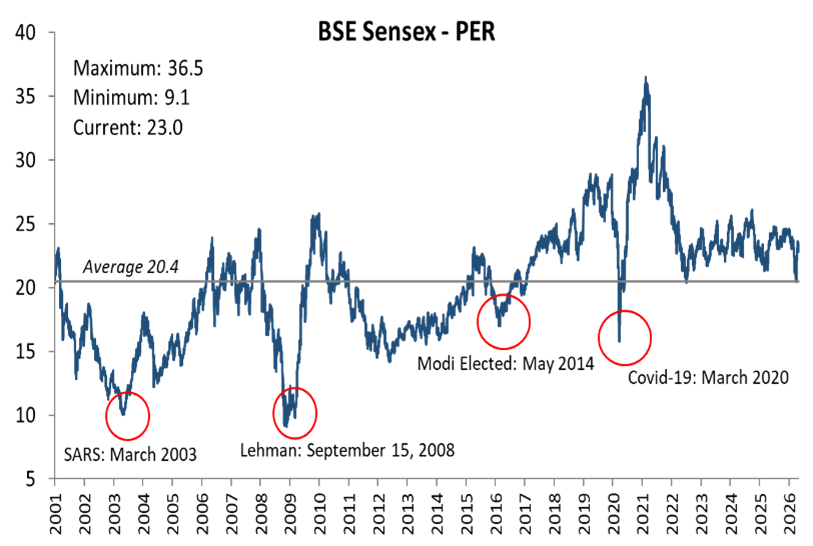
Source Graph 5: Bloomberg Finance L.P, Data as of April 30, 2026. PE = Price to Earnings Ratio. Past performance is not an indicator of future result.
Graph 6: and valuations are attractive on a relative basis
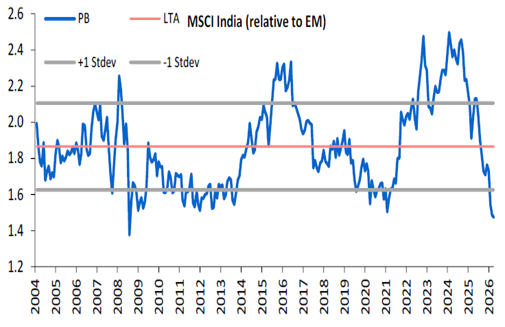
Source Graph 6: Morgan Stanley Research, PB = Price to Book Ratio. Past performance is not an indicator of future result.
Prime Ministers’ Guided Message
As the Prime Minister, Narendra Modi, exhorts the nation to postpone gold purchases, moderate fuel consumption, adopt natural farming, reduce edible oil in cooking, and to avoid foreign vacations, it is natural to feel anxious and concerned about the state of the economy.8
The conflict in Middle East has continued for longer than expected. As we wrote in West Asia Conflict will delay Foreign Investor allocation, India faces idiosyncratic risks from the conflict which can complicate India's near-term macro situation.
The immediate worry though within the government seems to be stemming from the depreciation of the Indian Rupee. The solution to that is to augment capital flows, something which India has struggled to receive in the past 18 months
The concerns on the economy have increased in the last two months. With the prospect of EL-NINO, India farm and rural incomes may also get impacted if monsoon indeed remains poor.9 India must hope and pray that the conflict ceases soon and brings in relief on key commodity supply at softer prices.
IIn our view, Indian stock market valuations appear attractive and given the under-allocated foreign investor positioning, a reversal in sentiment and some positive inflows remains a possibility. However, given the enhanced macro risks, it will be prudent to be cautious and gradually scale the India allocation.
Sources and Footnotes
- Source: Hindu Business Line, India enjoying the ‘There is no alternative factor’ – August 2022
- Source: McKinsey, India’s Private Markets: The Global LP view, March 2026
- Source: Morgan Stanley research, India Equity Strategy, April 2026
- Source: Hindu Business Line, May 2026
- Source: HSBC Global Investment Research, India Strategy Note, August 2025
- Source: Bloomberg Finance L.P.
- Source: CLSA, Greed and Fear, May 2026
- Source: BBC PM Modi urges Indians.. 11 May 2026
- Source: Reuters, How EL Nino-driven weaker rains could impact India
Glossary
- MSCI:Morgan Stanley Capital International. They create global equity indices
- ACWI:All Country World Index as created by MSCI to represent world equity markets
- EM:Emerging Markets Index as created by MSCI to represent emerging market equity markets
- GEM:Global Emerging Market – Funds which invest in Global Emerging Markets
- EPS:Earnings Per Share of the companies in the BSE-30 Sensex Index
- PER:Share Price to Earnings per share ratio of the BSE-30 Sensex Index
- PB:Shar Price to Book Value ratio of the MSCI India Index relative to MSCI EM Index
Important Disclosures & Disclaimers
Quantum Advisors Private Limited (QAPL) is registered in India and holds a Portfolio Management License from Securities and Exchange Board of India (SEBI), India vide registration number INP000000187. It is also registered with the Securities Exchange Commission, USA as an Investment Adviser and a Restricted Portfolio Manager with the Canadian Provinces of British Columbia (BCSC), Ontario (OSC), and Quebec (AMF). It is not registered with any other regulator. (Note- Registration with the above regulators does not imply any level of skill or training).
Investments in markets is subject to Market Risk. There is no guarantee or assurance that the historical results are indicative of future results.
The views expressed herein shall constitute only the opinions and any information contained in this material shall not be deemed to constitute an advice or an offer to sell/purchase or as an invitation or solicitation to invest in any security and further Quantum Advisors Private Limited (QAPL) and its employees/directors shall not be liable for any direct or indirect loss, damage, liability whatsoever arising from the use of this information.
Information sourced from third parties cannot be guaranteed or was not independently verified. Whilst no action has been solicited based upon the information provided herein, due care has been taken to ensure that the facts are accurate, and the views given are fair and reasonable as on date. All the forward-looking statements made in this communication are inherently uncertain and we cannot assure the reader that the results or developments anticipated will be realized or even if realized, will have the expected consequences to or effects on, us or our business prospects, financial condition or results of operations.
Readers are cautioned not to place undue reliance on these forward-looking statements in making any investment decision. Forward-looking statements made in this communication apply only as of the date of this communication. While we may elect to update forward-looking statements from time to time, we specifically disclaim any obligation to do so, even if internal estimates change, unless otherwise required by applicable Securities laws.
This article is for educational and discussion purposes only and is not intended as an offer or solicitation for the purchase or sale of any investment in any jurisdiction. No advice is being offered nor recommendation given.
Recipients should exercise due care and caution and if necessary, obtain the professional advice prior to taking any decision based on this information.
The "Index" is a product of Asia Index Private Limited (AIPL), which is a wholly owned subsidiary BSE has been licensed for use by QAPL. BSE® is a registered trademark of BSE Limited (“BSE”) and these trademarks have been licensed for use by AIPL and sublicensed for certain purpose by QAPL. All rights reserved. Redistribution, reproduction and/or photocopying in whole or in part are prohibited without written permission of AIPL. For more information on any of AIPL’s indices please visit http://www.asiaindex.com/. None of AIPL, BSE, their affiliates nor their third party licensors make any representation or warranty, express or implied, as to the ability of any index to accurately represent the asset class or market sector that it purports to represent and none of AIPL, BSE or their affiliates nor their third party licensors shall have any liability for any errors, omissions, or interruptions of any index or the data included therein.
BSE 500 is a free-float-adjusted, market-cap-weighted index of 500 companies listed on the Bombay Stock Exchange.
BSE 500 comprises of stocks which are highly liquid (predominantly Large Cap) and broadly covers our investment universe under this investment strategy. Hence, we believe it makes a good benchmark as the portfolio has a bias towards highly liquid stocks. However, the Composite’s performance may not be strictly comparable with the performance of the Benchmark, due to inherent differences in the construction of the portfolios, and the volatility of the benchmark over any period may be materially different than that of the composite over the same period.
Certain information contained herein (the “Information”) is sourced from/copyright of MSCI Inc., MSCI ESG Research LLC, or their affiliates (“MSCI”), or information providers (together the “MSCI Parties”) and may have been used to calculate scores, signals, or other indicators. The Information is for internal use only and may not be reproduced or disseminated in whole or part without prior written permission. The Information may not be used for, nor does it constitute, an offer to buy or sell, or a promotion or recommendation of, any security, financial instrument or product, trading strategy, or index, nor should it be taken as an indication or guarantee of any future performance. Some funds may be based on or linked to MSCI indexes, and MSCI may be compensated based on the fund’s assets under management or other measures. MSCI has established an information barrier between index research and certain Information. None of the Information in and of itself can be used to determine which securities to buy or sell or when to buy or sell them. The Information is provided “as is” and the user assumes the entire risk of any use it may make or permit to be made of the Information. No MSCI Party warrants or guarantees the originality, accuracy and/or completeness of the Information and each expressly disclaims all express or implied warranties. No MSCI Party shall have any liability for any errors or omissions in connection with any Information herein, or any liability for any direct, indirect, special, punitive, consequential or any other damages (including lost profits) even if notified of the possibility of such damages.
Important Notice
This newsletter contains hyperlinks to websites operated by third parties. These linked websites are not under the control of QAPL and are provided for your convenience only. Clicking on those links or enabling those connections may allow third parties to collect or share data about you. When you click on these links, we encourage you to read the privacy notice of the website you visit. QAPL does not endorse, or guarantee products, services or advice offered by these websites.
Our Strategies
Explore how our two main strategies – Predictable India Equity and India Integrity Equity - with demonstrated success of our tried and tested research and investment processes can ensure your India equity allocation will have higher predictable outcomes and no surprises.
Q India Value Equity Strategy
20+ years of India Long-only, Liquid, High-Governance, Margin of safety = Predictability
Integrity screen since 1996, strategy Track record since 2000.
Q India Responsible Returns Strategy
Liquid, proprietary Integrity Scores, Financial Soundness
Integrity Screen since 1996, enhanced criterion since 2015, strategy Track Record since 2019; strategy AuM: $9.7 mn Mandate Capacity: $5 billion
Quantum Advisors pioneered a quantitative as well as qualitative analytical approach to equity investing in India, providing for the first time, consistently applied valuation metrics to evaluate investment opportunities in India’s emerging stock markets. Over the years, Quantum Advisors has continued and enhanced its tradition of extensive financial analysis and value investing, as it has evolved into an investment advisor and asset manager.
Our investment philosophy and strategy involves the use of intensive qualitative and quantitative fundamental analysis. We build and monitor our clients’ portfolios actively while at the same time avoiding excessive trading, and control risk by endeavoring to keep our clients’ portfolio adequately diversified, both in terms of the sectors included in those portfolios, as well as with respect to the level of concentration in any specific security.