


The narrative around global investing is often built around stories. Investors weave these stories around cycles, themes, and opportunities to justify and support their investment rationale.
When these stories are simple and the rationale is sound, they can benefit investors.
However, investment bankers and asset managers, often make straightforward strategies appear complex to justify their fees and expertise. You’ll frequently encounter mnemonics or catchy phrases explaining investment rationales. My advice: when an investment rationale becomes a ‘theme’ or a ‘meme’, it’s time to be cautious about the risks and expected returns.
We are not referring to classic ‘bubbles like ‘Tulip Mania’, or the ‘dotcom’ bubble. These were speculative frenzies which led to dramatic gains and sudden crashes 1.
Instead, we are focusing on the positives and negatives of theme-based investing.
The Allure and Pitfalls of Thematic Investing
Consider the current global theme: Artificial Intelligence (AI). Many call it a ‘mega trend’, one that could shape investment outcomes for decades. Investors are chasing the AI theme by allocating capital to companies, sectors, and countries poised to benefit from the AI boom. Conversely, those not aligned with the AI narrative are seeing capital outflows.
“India is Not AI” Narrative
‘India is the world’s anti-AI market’ or ‘India is an AI loser’ – a phrase used in a research report to explain India’s current underperformance relative to China, Korea, Taiwan etc 2.
Table 1: India underperforms over last 1 year, but outperforms over the long-term
| MSCI Index | 1 Year | 5 Year | 10 Year | 20 Year | 25 Year |
|---|---|---|---|---|---|
| MSCI ACWI World Index | 17.8% | 14.1% | 12.5% | 8.7% | 7.2% |
| MSCI Emerging Markets Index | 18.2% | 7.5% | 8.4% | 6.5% | 8.0% |
| MSCI India Index | -11.1% | 14.0% | 9.5% | 8.5% | 10.6% |
(Source: Bloomberg Finance L.P, MSCI; Gross Returns in USD); Above 1 year returns are annualized, Returns as at September 30, 2025 ; Past performance does not guarantee future return. This is only for representation and understanding purpose and should not be construed as a recommendation to invest.
Foreign investors are pulling capital from India and reallocating it to markets perceived as AI beneficiaries.
This argument holds weight from an ‘AI theme investing’ perspective. India has lagged in the development of foundational Large Language Models (LLMs)3, nor does it design or manufacture high-end semiconductor chips for generative AI4. There’s no AI-driven data centre boom, and India’s large IT services sector could be threatened by widespread AI adoption. Investors chasing the AI story are logically allocating to US, China, Korea, and Taiwan, markets leading the AI-driven boom.
As investors who trend follow theme driven investing, the above trade seems logical. However, the hype often leads to over-valuation and misallocation of capital. We have seen over time, that some investing themes dissipate, as investors rotate out and move to other stories and investing themes which find favour.
Thematic investment is best suited for tactical, short-term allocations and requires deep expertise to execute well. It may be profitable, but it’s difficult to replicate across cycles.
In contrast, strategic allocation, by its long-term nature, should be simple, predictable, and replicable. As we have argued over two decades, India is not just a theme; it’s a strategic, long-term allocation that is both simple and predictable.
Do read, The Great India Under-Allocation, to understand the context of how foreign investors invest in India and the recent trend.
Themes Change, India Endures: A Historical View
Over the past 25 years, India investing has been assigned many themes, both positive and negative:
- In 2003, Goldman Sachs included India in
BRIC
. 5 - In 2013, Morgan Stanley labeled India as part of the
Fragile Five
. 6 - In 2014–15, PM Modi’s victory elevated India to
TINA
(There Is No Alternative). - In 2019–20, Xi Jinping’s domestic policies and purges led to the
China + 1
narrative. 7 - In 2024–25, India’s lack of high technology and AI has led to the
Not AI
theme. 2
Despite these shifting narratives, India investing has thrived and survived. The real change during these periods is in investors’ expectations and outcomes.
The two charts below is a testament to the long-term case of India being a simple, strategic, long-term allocation.
Chart 1 and 2: India Investing – Across Global Mood Swings
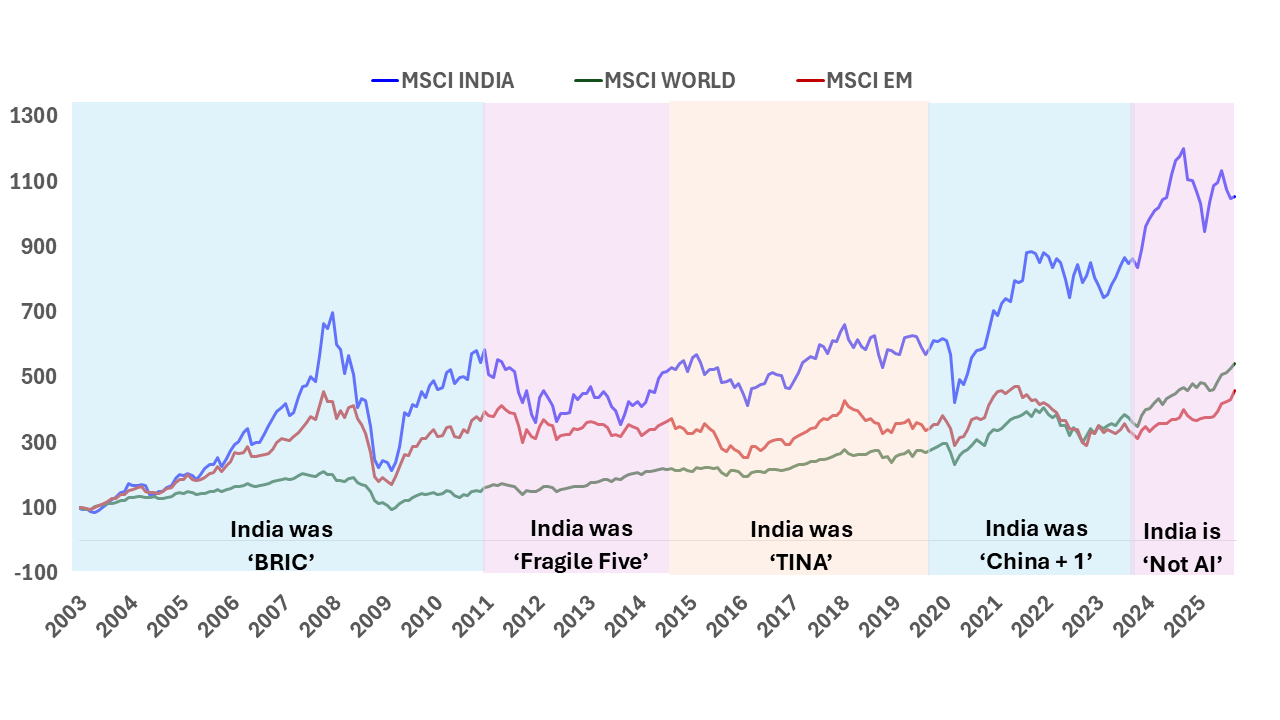
Source: LSEG DataStream, Rebased Data from January 01, 2003 upto October 31, 2025. All Data in USD, EM = Emerging Markets
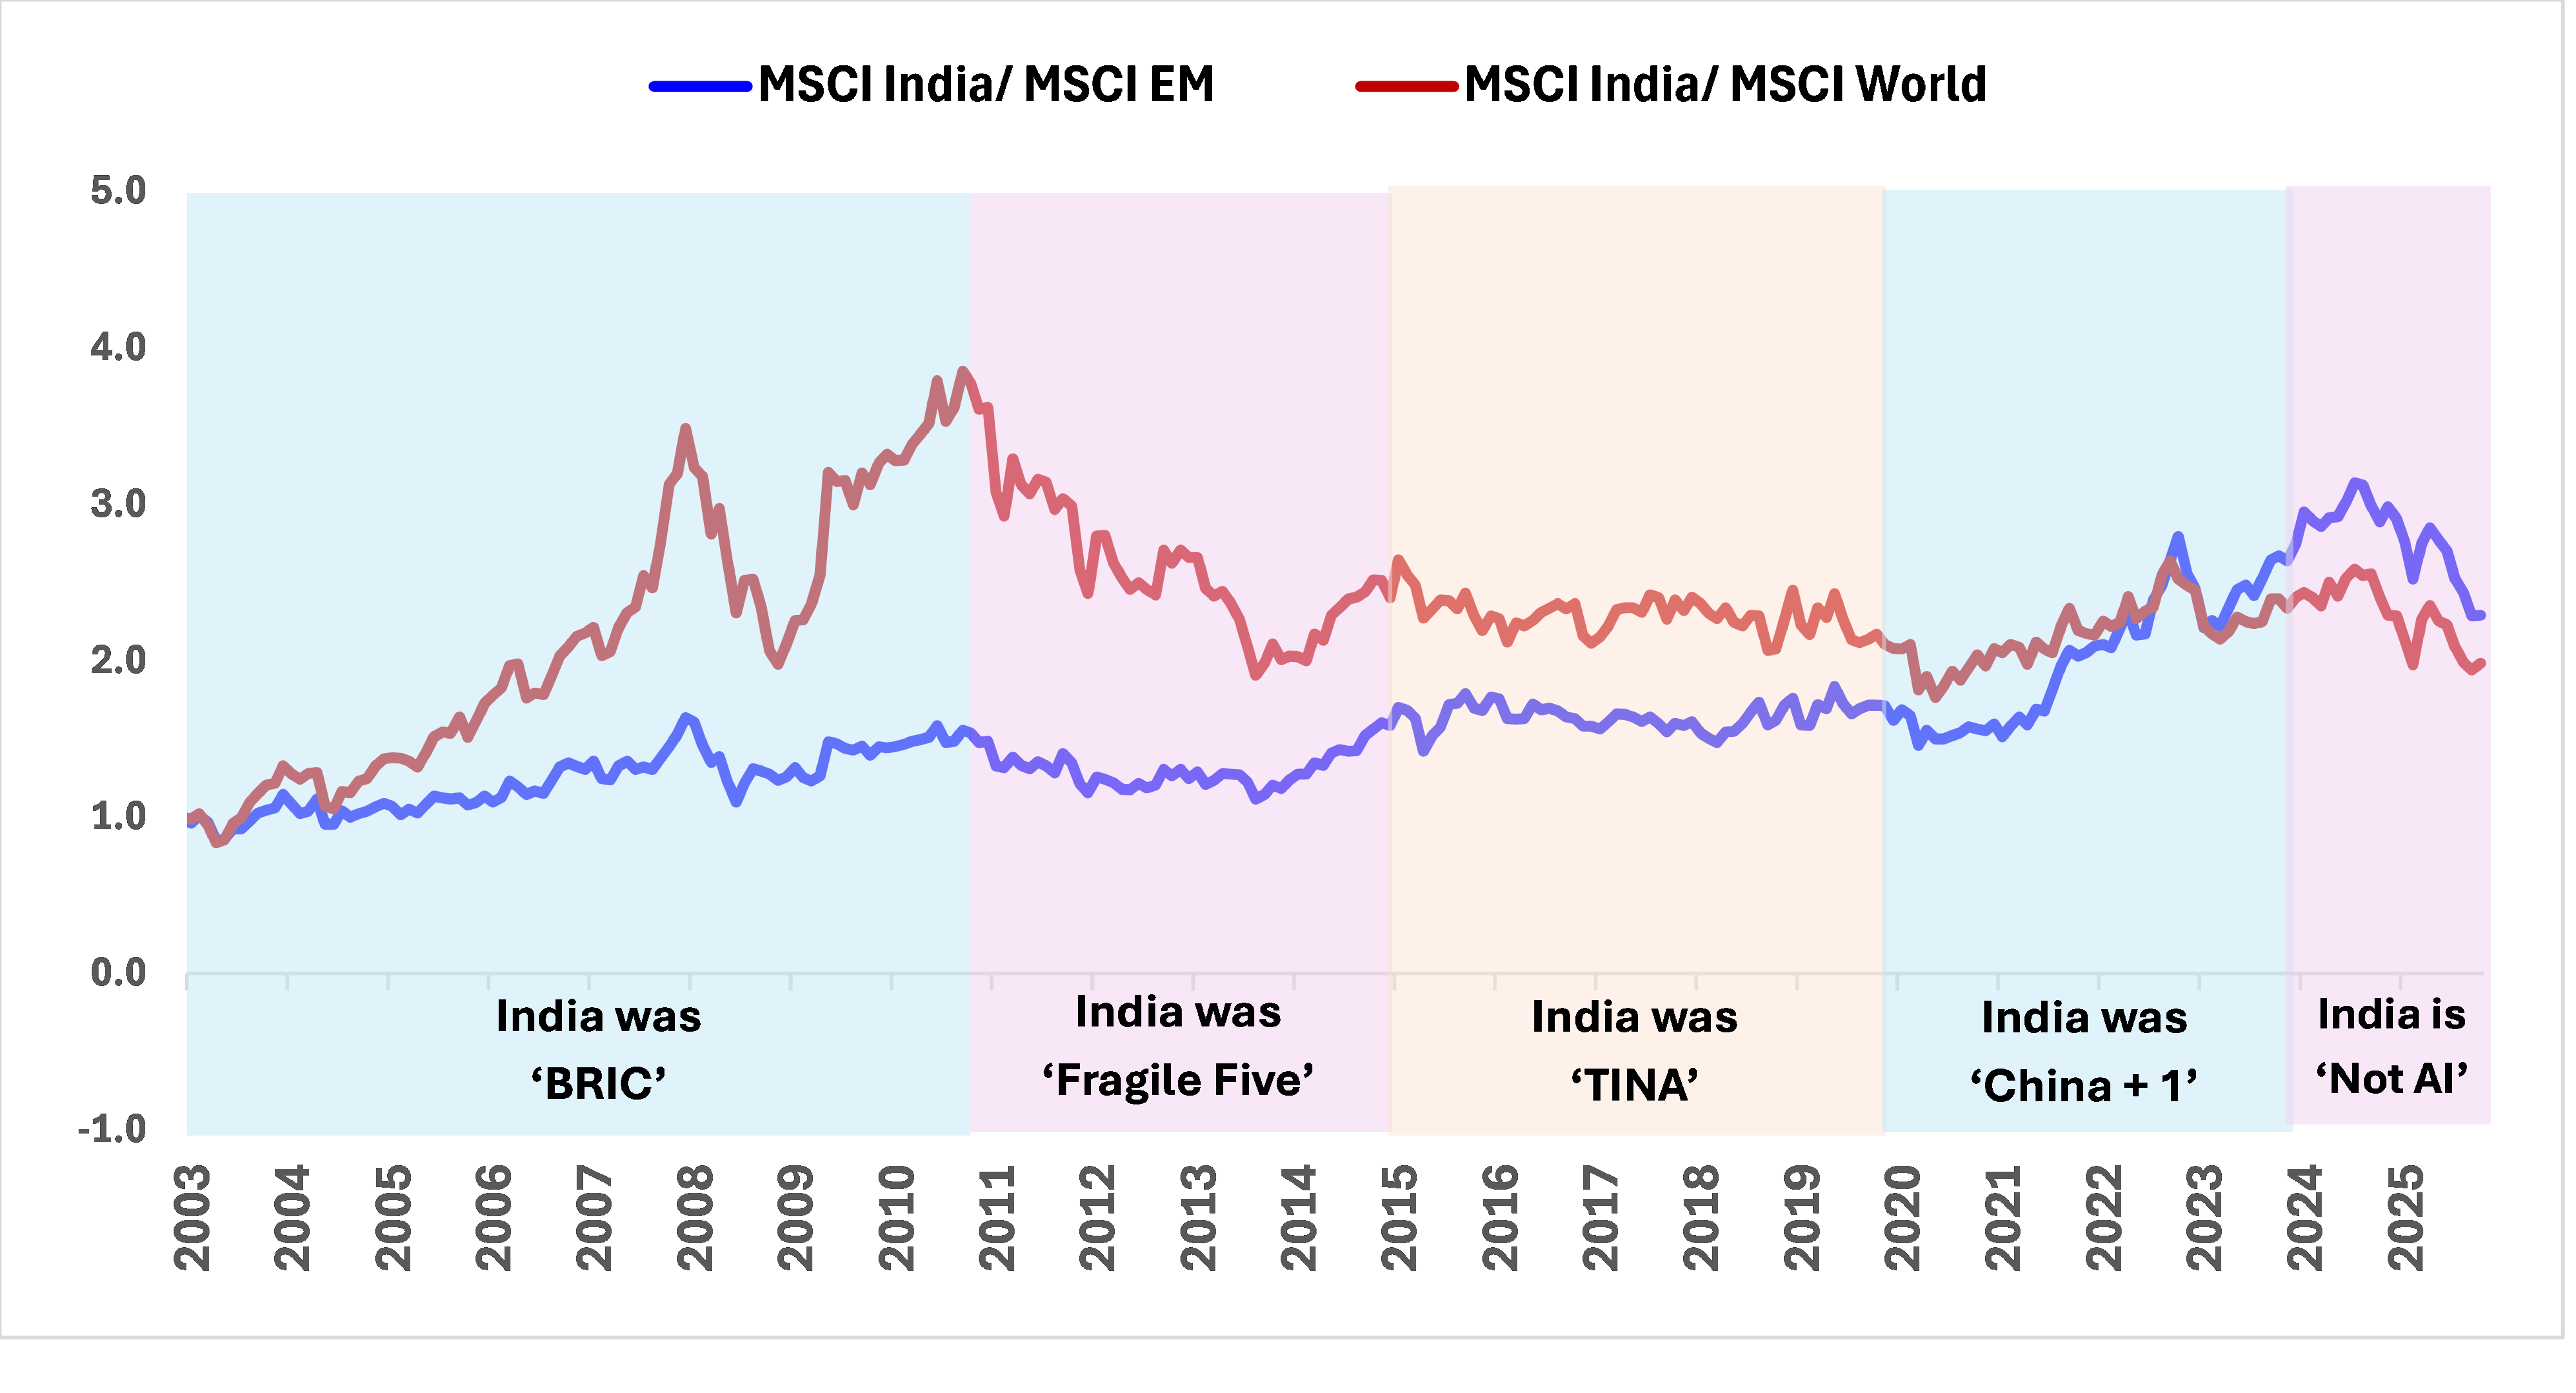
Source: LSEG DataStream, Rebased Data from January 01, 2003 upto October 31, 2025. All Data in USD, EM = Emerging Markets. Chart shows MSCI India’s outperformance over MSCI EM and MSCI World index. Past performance does not guarantee and is not indicative of future results.
Lessons from Past Themes (BRIC, TINA, China+1)
For instance, India was grouped as part of ‘BRIC’ - Brazil, Russia, India and China – four emerging economies whom Goldman Sachs ‘dreamed’ as long-term growth engines into 2050.5
It coincided with a global growth surge, and we found investors expecting India’s near-term real GDP growth of 8-9% to continue. India began receiving investment flows with return expectations based on that 8-9% real GDP growth rate. ‘BRIC’ Funds proliferated 8. Flows moved from large cap equity to mid and small cap stocks. A lot more capital was being committed to private equity in the hope of even higher returns. Long-term Investors chanced their luck began betting on tier 2/3 real estate and green field infrastructure9.
The first shock to the “BRIC” thesis was the global financial crisis of 2008. By 2011-2012, as the growth fizzled out8, many of these investors exited in the next few years frustrated with their outcomes and extorted,INDIA - I Will Never Do It Again!10
A similar exuberance occurred from 2014-2017 under Prime Minister Modi’s ‘Ache Din’ (Good Days) campaign11.The ‘There is no Alternative’ (TINA) narrative took hold. to India. While we agree and have made the case for dedicated allocations to India, however we also caution on being realistic on your return and outcome expectations.
Stock markets rose on expectations and sentiment, but corporate earnings remained subdued. Growth settled closer to 6%, and thematic expectations were tempered. (see chart 3 below, shows flat earnings growth between 2014-2020, whereas index value increased)
The 'China + 1' narrative seemed real with some production shifting from China to other destinations for cost and geopolitical reasons. However, apart from Apple's mobile assembly in India, most 'China + 1' capital inflows were in private equity and venture capital between 2019-202212. Meaningful manufacturing relocation has yet to materialize.
The 'India is Not AI' theme has merit—India lacks significant technological prowess outside of space research. When ChatGPT and other LLMs emerged, India had little to show. Generative AI chips are dominated by US, Taiwan, and Korea. China's 'DeepSeek' open-source LLM has drawn global attention back to China's R&D capabilities. In this AI-driven environment, investors have questioned India's markets and valuations, leading to outflows and underperformance versus global and emerging markets.
The India Public Equity Story is about Earnings Growth and Superior Return Ratios
However, as with previous themes, it's important to maintain realistic expectations and outcomes. Investors should recognize that India is not a high-tech frontier. Instead, India may offer consistent economic growth, reflected in corporate earnings, with businesses known for better governance and superior return ratios.
Chart 3 and 4: Invest in India for Earnings Growth and....
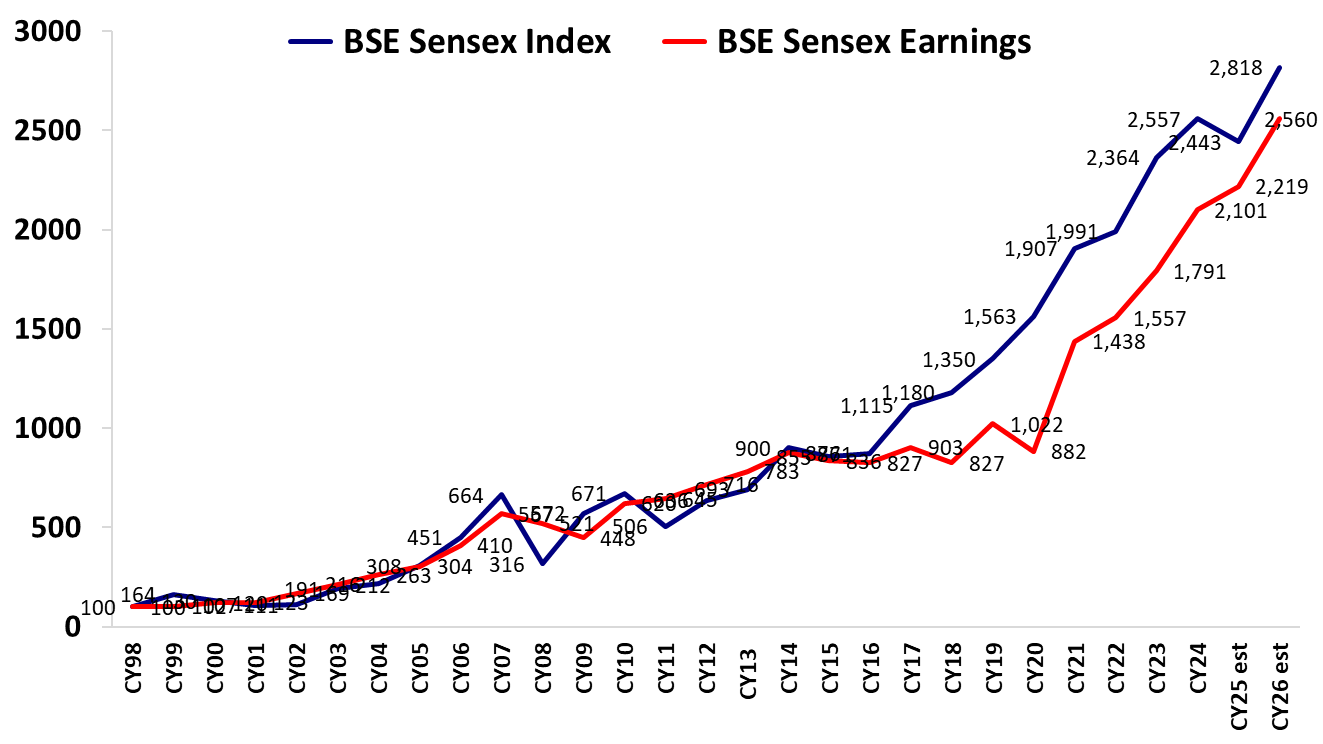
Source: CLSA and Bloomberg Finance L.P., As of September 30, 2025. CY 25 and CY 26 are estimate numbers. Past performance does not guarantee and is not indicative of future results. The estimates provided are inherently uncertain and the actual results may differ.
Chart 4: ..... for superior Return Ratios
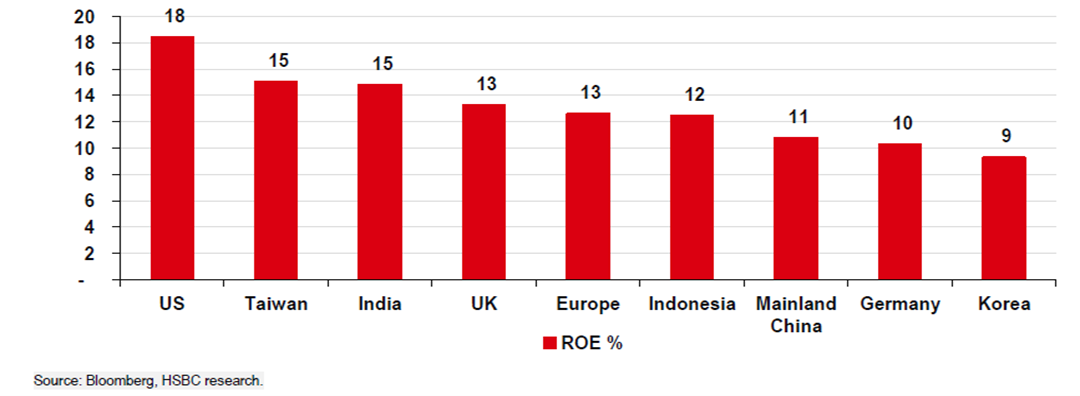
Source: HSBC Global Investment Research, India Strategy Note, August 2025
India's Unique Investment Case: Beyond the Themes
India may lack advanced technology, critical natural resources, and perfect governance. But it offers a bottom-up, diverse economic story. Growth is broad-based, spanning multiple sectors and regions. This diversity ensures that the benefits of growth are widely distributed and reflected in the stock market.
The link between GDP growth → corporate revenues → profitability → stock market returns has held true for decades.
Chart 5: GDP Growth = Equity Returns?
China GDP growth 2x India, Indian equity returns 4x China

Source: Bloomberg & MSCI, All data in USD, GDP and Index data is quarterly till June 2025. This is only for representation and understanding purpose and does not assure any promise or guarantee of same in the future. Past performance does not guarantee and is not indicative of future results
Conclusion: A Sensible, Strategic Allocation
Investing in Indian public equities offers a simple, predictable way to participate in India's growth story. Investors can maintain a realistic assessment of India and avoid being swayed by positive or negative themes and mnemonics.
Chart 6: Across 25 Years Of Mood Swings, Quantum 'Value' Gross Returns 1.7x > S&P 500
In 2005, India was "BRIC", In 2013, "India was Fragile Five", In 2015, "India was TINA"
In 2021, India was "China + 1"; India 2025, "India is not-AI"
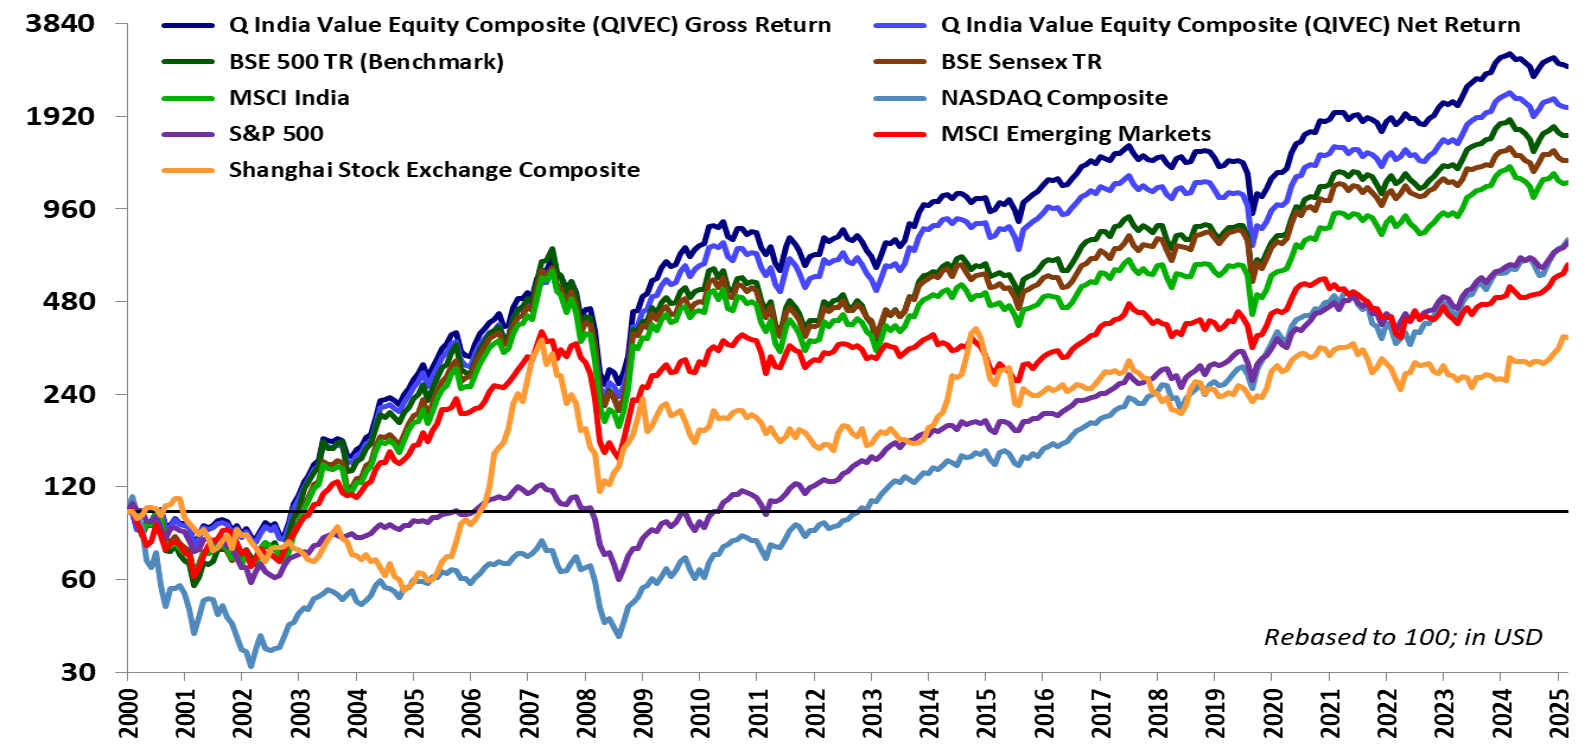
Long‑term performance comparison of Quantum India Value Equity Composite vs Indian and global equity indices.
Source: Quantum Advisors, MSCI, Bloomberg Finance L.P.; As of September 30, 2025; The value axis has been plotted based on logarithmic scale of 2. Data of other indices is provided for information purpose only and to allow investors to compare the performance of the account to that of certain indices. Past performance does not guarantee and is not indicative of future results. Please refer to disclosures and disclaimers for the above.
Sources and Notes:
- Wikipedia page on Financial Market Crashes
- HSBC Calls India World's Anti-AI Market, Financial Express, October 2025
- What it takes to build a foundational LLM, Outlook Business, October 2025
- India missed the Chip bus, now playing catch up, Economic Times, September 2025
- Goldman Sachs Investment research 'Dream onto 2050', 2003 – BRIC
- BBC news article on Fragile Five, 2013
- China is purging tech billionaires and celebrities, Los Angeles Times, September 2021
- Poor Returns cast cloud over BRIC Equity Funds, Reuters Article, September 2012
- Capital Flows to India, BIS Report, 2012
- Comment made by an Investor at a conference, November 2017
- 'Ache Din' Ad Campaign by BJP
- Foreign Investors are betting big, but not on the stock market, Article in Financial Express, July 2025
Important Disclosures & Disclaimers
Quantum Advisors Private Limited (QAPL) is registered in India and holds a Portfolio Management License from Securities and Exchange Board of India (SEBI), India vide registration number INP000000187. It is also registered with the Securities Exchange Commission, USA as an Investment Adviser and a Restricted Portfolio Manager with the Canadian Provinces of British Columbia (BCSC), Ontario (OSC), and Quebec (AMF). It is not registered with any other regulator. (Note- Registration with the above regulators does not imply any level of skill or training).
Q India Value Equity Strategy - Composite (Composite) is an aggregation of Client portfolios with a similar investment mandate and with no cash restrictions that are managed or advised by Quantum Advisors on a discretionary basis using the long only value equity strategy. The Composite does not include all client portfolios due to various client-imposed portfolio restrictions, even though all portfolios in this broad mandate are managed using the same strategy. The Composite represents 0.05% of the total AUM under the Q India Value Equity Strategy as on September 30, 2025.
Composite Gross return stated above are the returns achieved before the deduction of all fees and expenses except trading cost. Composite's Net returns are computed net of fees and expenses. Returns stated above are assuming reinvestment of all dividend and other earnings. Returns from cash and cash equivalents held in portfolios are included in the return calculations.
The various constituents of the Composite pay different management fees. The net-of-fee and expense returns of the Composite indicated in tables in this newsletter reflect the weighted average management fees paid to Quantum Advisors Pvt Ltd (QAPL) by the different constituents of the Composite.
As the different constituents of the Composite are subject to different management fee structures, the actual performance experienced by a constituent of the Composite may be worse or better than the net-of-fee-and-expense returns of the Composite.
The return shown in graph in this document are calculated using Time Weighted Rate of Return ("TWRR") method.
The firm has formulated an internal policy and procedures on inclusion, exclusion of the portfolio accounts and factoring significant cash flows for computing the performance of Composite which will be available upon request. Please note that the performance of individual client portfolio may vary from that of other investors and that generated by the Composite across all investors because of (1) the timing of inflows and outflows of funds; (2) difference in the portfolio composition because of restrictions and other constraint; and (3) difference in fees and expenses charged to each of the client accounts.
The "Index" is a product of Asia Index Private Limited (AIPL), which is a wholly owned subsidiary BSE has been licensed for use by QAPL. BSE® is a registered trademark of BSE Limited ("BSE") and these trademarks have been licensed for use by AIPL and sublicensed for certain purpose by QAPL. All rights reserved. Redistribution, reproduction and/or photocopying in whole or in part are prohibited without written permission of AIPL. For more information on any of AIPL's indices please visit http://www.asiaindex.com/. None of AIPL, BSE, their affiliates nor their third party licensors make any representation or warranty, express or implied, as to the ability of any index to accurately represent the asset class or market sector that it purports to represent and none of AIPL, BSE or their affiliates nor their third party licensors shall have any liability for any errors, omissions, or interruptions of any index or the data included therein.
BSE 500 is a free-float-adjusted, market-cap-weighted index of 500 companies listed on the Bombay Stock Exchange.
BSE 500 comprises of stocks which are highly liquid (predominantly Large Cap) and broadly covers our investment universe under this investment strategy. Hence, we believe it makes a good benchmark as the portfolio has a bias towards highly liquid stocks. However, the Composite's performance may not be strictly comparable with the performance of the Benchmark, due to inherent differences in the construction of the portfolios, and the volatility of the benchmark over any period may be materially different than that of the composite over the same period.
The firm sources benchmark-related data from Bloomberg.
Certain information contained herein (the "Information") is sourced from/copyright of MSCI Inc., MSCI ESG Research LLC, or their affiliates ("MSCI"), or information providers (together the "MSCI Parties") and may have been used to calculate scores, signals, or other indicators. The Information is for internal use only and may not be reproduced or disseminated in whole or part without prior written permission. The Information may not be used for, nor does it constitute, an offer to buy or sell, or a promotion or recommendation of, any security, financial instrument or product, trading strategy, or index, nor should it be taken as an indication or guarantee of any future performance. Some funds may be based on or linked to MSCI indexes, and MSCI may be compensated based on the fund's assets under management or other measures. MSCI has established an information barrier between index research and certain Information. None of the Information in and of itself can be used to determine which securities to buy or sell or when to buy or sell them. The Information is provided "as is" and the user assumes the entire risk of any use it may make or permit to be made of the Information. No MSCI Party warrants or guarantees the originality, accuracy and/or completeness of the Information and each expressly disclaims all express or implied warranties. No MSCI Party shall have any liability for any errors or omissions in connection with any Information herein, or any liability for any direct, indirect, special, punitive, consequential or any other damages (including lost profits) even if notified of the possibility of such damages.
The returns of all the indices reported above are gross total returns.
Data of other indices is provided for information purposes only and to allow investors to compare the performance of the Composite to that of certain indices (many of which are well known and widely recognized). While we generally believe these comparisons provide meaningful and useful information to investors (for example, as a way of comparing an investment in the Composite to other types of investments that investors might make), inclusion of any particular index is not a representation that the index is an appropriate benchmark for evaluating the Composite's performance. In particular, the volatility of indices over any period may be materially different from that of the Composite over that same period.
The views expressed herein shall constitute only the opinions and any information contained in this material shall not be deemed to constitute an advice or an offer to sell/purchase or as an invitation or solicitation to invest in any security and further Quantum Advisors Private Limited (QAPL) and its employees/directors shall not be liable for any direct or indirect loss, damage, liability whatsoever arising from the use of this information.
Information sourced from third parties cannot be guaranteed or was not independently verified. Whilst no action has been solicited based upon the information provided herein, due care has been taken to ensure that the facts are accurate, and the views given are fair and reasonable as on date. All the forward-looking statements made in this communication are inherently uncertain and we cannot assure the reader that the results or developments anticipated will be realized or even if realized, will have the expected consequences to or effects on, us or our business prospects, financial condition or results of operations.
Readers are cautioned not to place undue reliance on these forward-looking statements in making any investment decision. Forward-looking statements made in this communication apply only as of the date of this communication. While we may elect to update forward-looking statements from time to time, we specifically disclaim any obligation to do so, even if internal estimates change, unless otherwise required by applicable Securities laws.
This article is for educational and discussion purposes only and is not intended as an offer or solicitation for the purchase or sale of any investment in any jurisdiction. No advice is being offered nor recommendation given.
Recipients should exercise due care and caution and if necessary, obtain the professional advice prior to taking any decision based on this information.
Important Notice:
This newsletter contains hyperlinks to websites operated by third parties. These linked websites are not under the control of QAPL and are provided for your convenience only. Clicking on those links or enabling those connections may allow third parties to collect or share data about you. When you click on these links, we encourage you to read the privacy notice of the website you visit. QAPL does not endorse, or guarantee products, services or advice offered by these websites.
Our Strategies
Explore how our two main strategies – Predictable India Equity and India Integrity Equity - with demonstrated success of our tried and tested research and investment processes can ensure your India equity allocation will have higher predictable outcomes and no surprises.
Q India Value Equity Strategy
20+ years of India Long-only, Liquid, High-Governance, Margin of safety = Predictability
Integrity screen since 1996, strategy Track record since 2000.
Q India Responsible Returns Strategy
Liquid, proprietary Integrity Scores, Financial Soundness
Integrity Screen since 1996, enhanced criterion since 2015, strategy Track Record since 2019; strategy AuM: $9.7 mn Mandate Capacity: $5 billion
Quantum Advisors pioneered a quantitative as well as qualitative analytical approach to equity investing in India, providing for the first time, consistently applied valuation metrics to evaluate investment opportunities in India’s emerging stock markets. Over the years, Quantum Advisors has continued and enhanced its tradition of extensive financial analysis and value investing, as it has evolved into an investment advisor and asset manager.
Our investment philosophy and strategy involves the use of intensive qualitative and quantitative fundamental analysis. We build and monitor our clients’ portfolios actively while at the same time avoiding excessive trading, and control risk by endeavoring to keep our clients’ portfolio adequately diversified, both in terms of the sectors included in those portfolios, as well as with respect to the level of concentration in any specific security.