


Quantum Advisors was founded by Ajit Dayal in January 1990, eighteen months before the first significant set of economic reforms in India were announced in July 1991.
These “first generation reforms” allowed the Indian economy to break out of the ‘Hindu’ rate of growth of sub-4% between 1960’s and 1980’s.
The name ‘Quantum’ originates from the Quantum theory in physics and Planck’s constant ‘h’: the amount of energy required to take an electron from a lower level of orbit to a higher level of orbit.
We were determined to take the then closed and archaic Indian capital markets from a lower level of orbit to a higher level of orbit.
We do not think this worry has got anything to do with the form of political system. Corporations and
Subbu joined Quantum in 1996: Subbu and Ajit are one of the longest tenured investment teams in Indian equity, having worked together for 24 years.
India Will Be A Large Part Of The Global Economy: India’s continued growth will contribute to GHG emissions
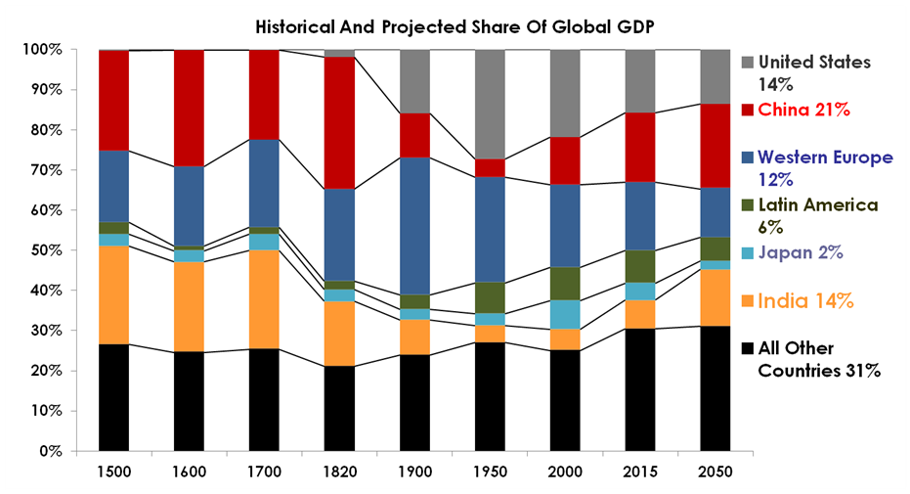
Source: Quantum Advisors; Angus Maddison, University of Groningen
India’s Economy Will Grow >6% p.a. for decades…
GDP growth rate across 10 governments has been 6.1% p.a. over the last 41 years
6.5% is a good long-term assumption; 8% is NOT a good long-term assumption!
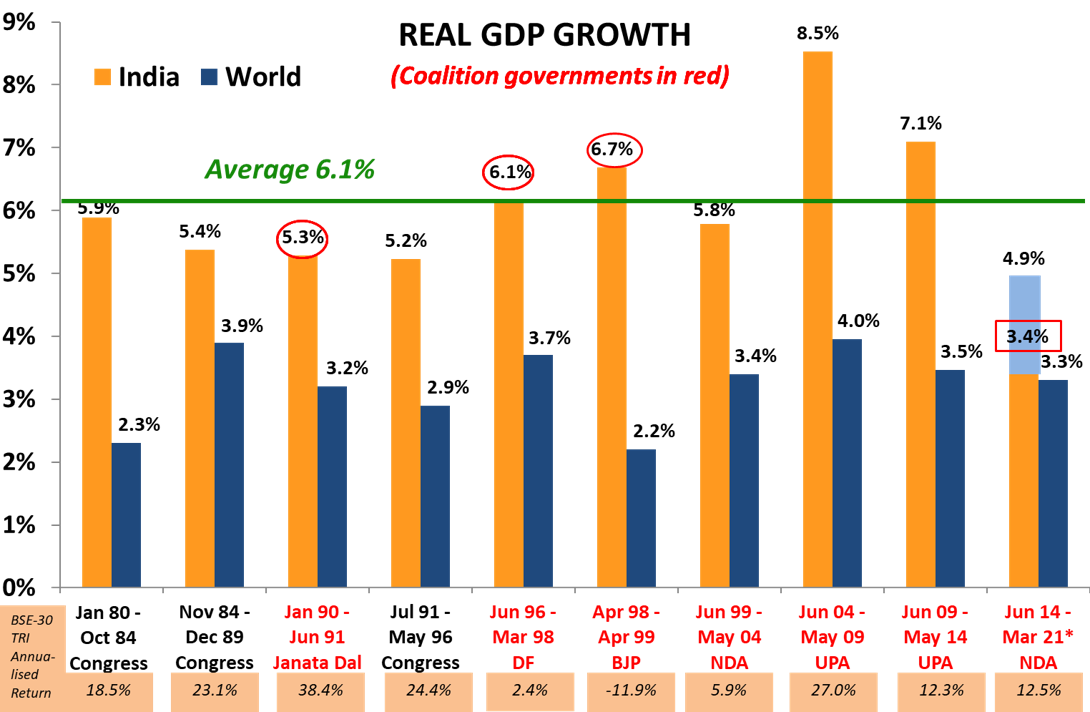
Source: RBI and www.parliamentofindia.nic.in as of March 2021.
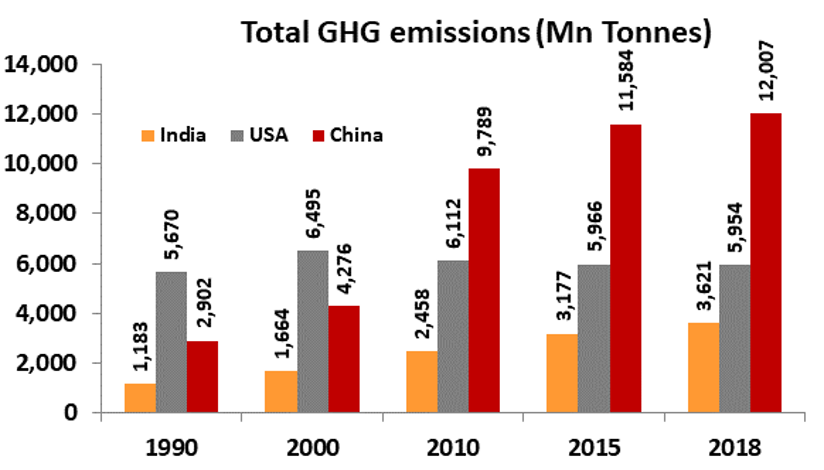
India is ‘Ground Zero’ to tackle global climate change…
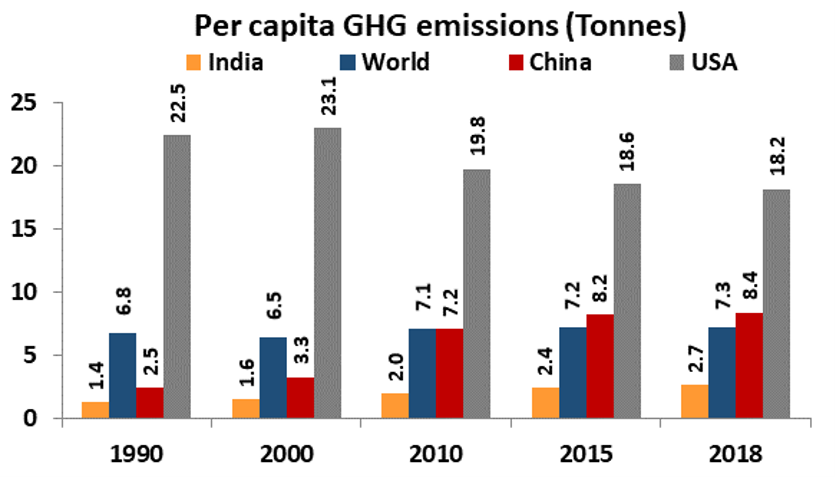
India cannot be blamed for climate change…yet
Source:
India’s per capita emission is currently just 2.7 tpa – but what will happen as India continues to develop?
Source:
If an Indian was to have the same consumption habits as an American or European today, GHG will be 38% higher compared to the current global emission levels of 55 bn tonnes
You may stop a virus from entering your backyard – but can you stop Greenhouse Gases?
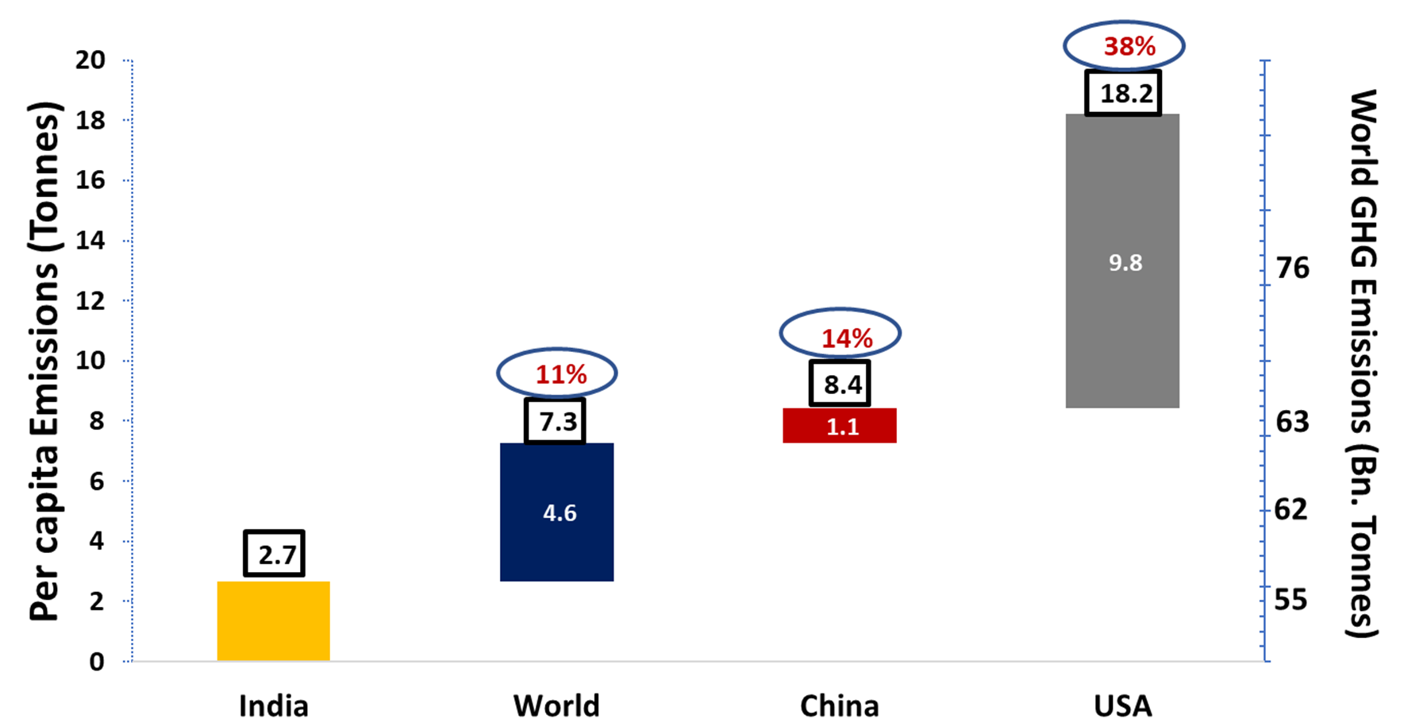
Bar chart comparing per capita CO₂ emissions—India (2.7 tonnes), World (7.3), China (8.4), and USA (18.2)—with shares of global emissions highlighted, showing the USA highest and India lowest.
Source:World Resources Institute,Global Carbon Atlas, Climatescoreboard.org, QASL Estimates
If an Indian was to have the same consumption habits as an American or European today, GHG will be 95% higher compared to the targeted global GHG emissions of 22 bn tonnes in a “2 C degree target” scenario
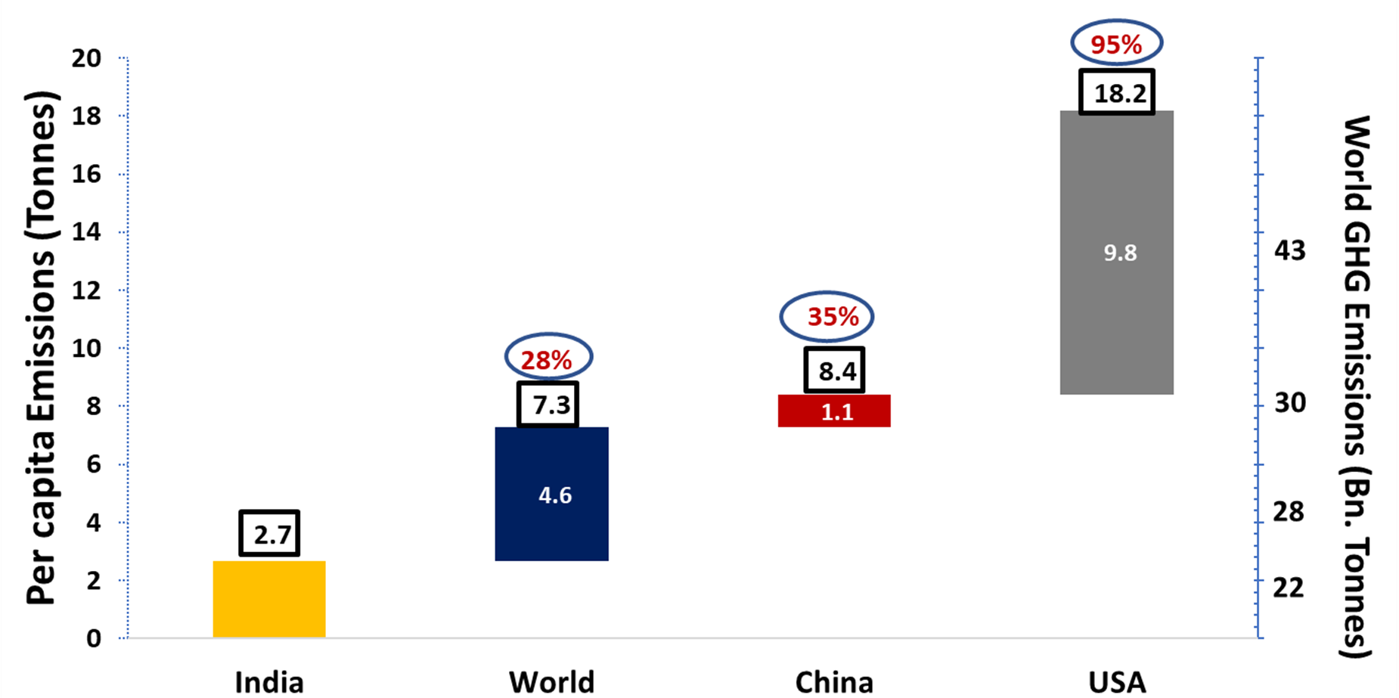
Bar chart comparing per capita emissions—India ~2.7 tonnes, world ~7.3, China ~8.4, USA ~18.2—showing the USA highest and India lowest, with corresponding shares of global emissions highlighted under a 2°C global climate target scenario.
Source:World Resources Institute,Global Carbon Atlas, Climatescoreboard.org, QASL Estimates
If an Indian was to have the same consumption habits as an American or European today, GHG will be 208% higher compared to the targeted global emission of 10 bn tonnes in a “1.5 C degree target” scenario
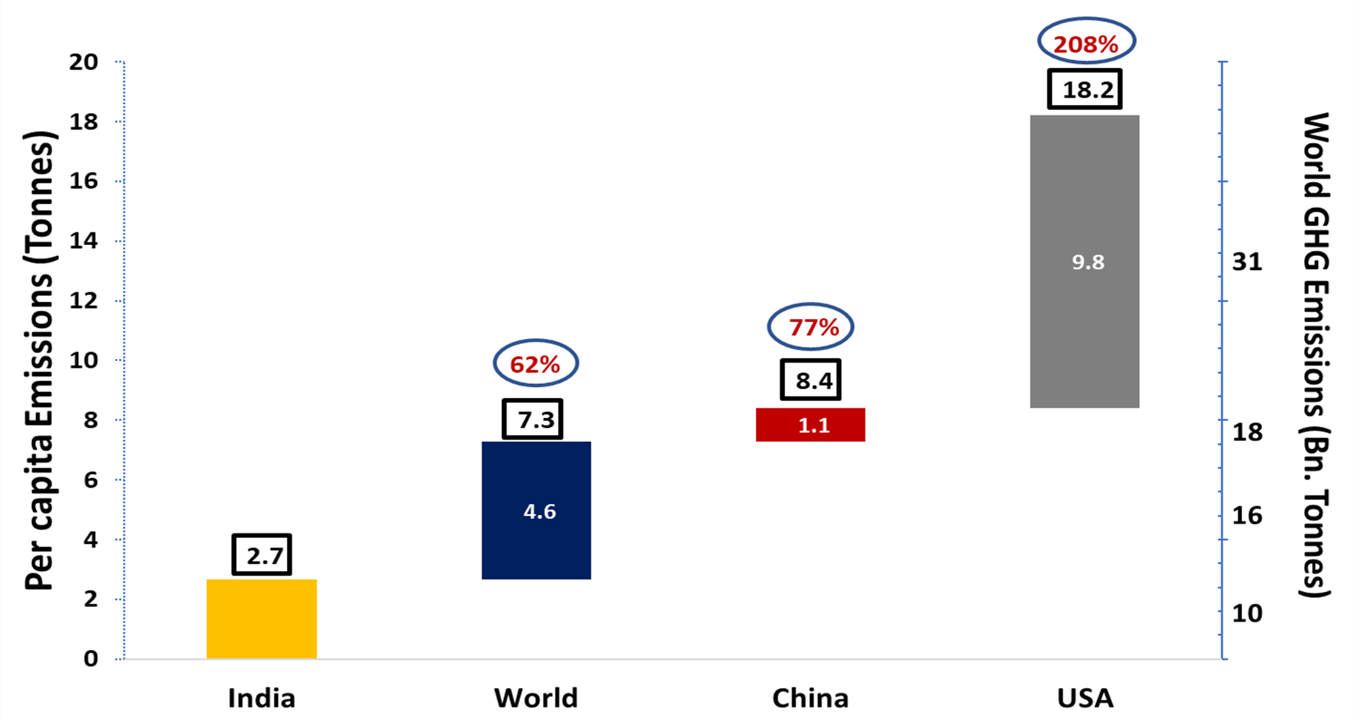
Bar chart comparing per capita emissions—India ~2.7 tonnes, world ~7.3, China ~8.4, USA ~18.2—showing the USA highest and India lowest, with corresponding shares of global emissions highlighted under a 1.5°C global climate target scenario.
Source:World Resources Institute,Global Carbon Atlas, Climatescoreboard.org, QASL Estimates
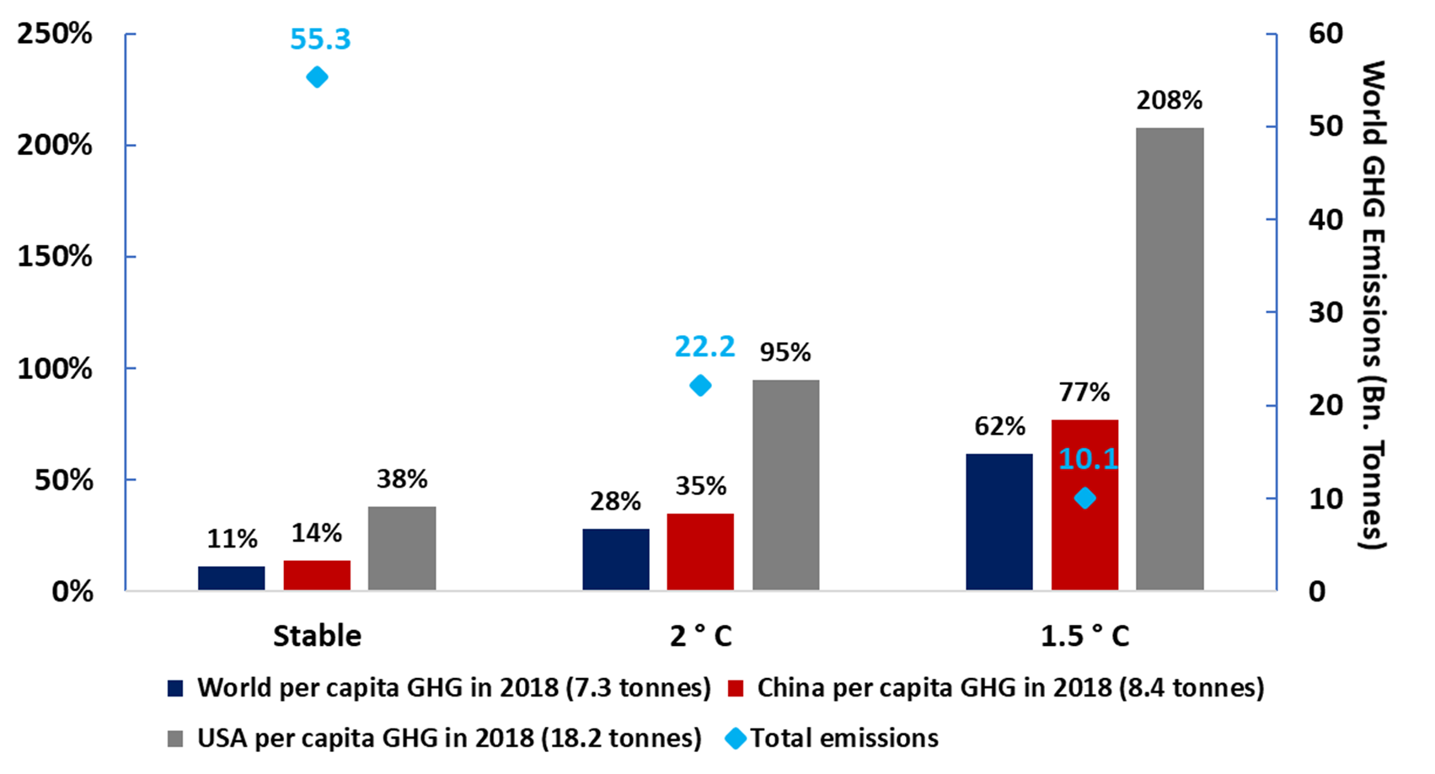
This is why India is ‘Ground Zero’ to address climate change…
Source:
Governments may stop a virus from entering your country – but can they prevent Greenhouse Gases from reaching your backyard?
Will India fulfil its Paris Pledge on Climate Change?
- “(India) has saved the world, entire humanity, from a major tragedy by effectively controlling coronavirus” Prime Minister Narendra Modi at the WEF in Jan 2021.
- “(India) has saved the world, entire humanity, from a major tragedy by effectively controlling coronavirus” Prime Minister Narendra Modi at the WEF in Jan 2021.
- “India’s commitment to give vaccines to humanity…The Pharmacy of the World will deliver to overcome the COVID challenge”
Mr. Jaishankar, External Affairs Minister’s tweet in Jan 2021. - “(India) has saved the world, entire humanity, from a major tragedy by effectively controlling coronavirus” Prime Minister Narendra Modi at the WEF in Jan 2021.
- • “India’s commitment to give vaccines to humanity…The Pharmacy of the World will deliver to overcome the COVID challenge”
Mr. Jaishankar, External Affairs Minister’s tweet in Jan 2021.
By March 2021, India was running short of vaccines and its people were terrorized by the Delta variant – now freely floating around the world and stalling the return to normalcy.
If a country makes a misstep fighting a pandemic, border security laws can prevent a virus from India landing in airports in other parts of the world
What if India fails to meet its obligations under the Paris Pledge on Climate Change?
How do you stop GHG emissions from India reaching your backyard?
India’s likely failure to meet the targets of the Paris Climate Accord could be matched by similar failures in Africa, Bangladesh, Cambodia, China, Indonesia, Vietnam…
Vaccine nationalism has prolonged the Covid-19 pandemic.
- Having failed to learn a lesson, the developed world is inward-looking and trying to solve GHG within its borders.
- The Paris Climate Accord is doomed to fail….............
- Having failed to learn a lesson, the developed world is inward-looking and trying to solve GHG within its borders.
- The Paris Climate Accord is doomed to fail…unless…
- Unless the money lying with pension funds and Governments in the developed world is invested in developing countries to tackle the challenges of climate change
- 1% of the money they control should be invested in efforts to facilitate consumption patterns to meet climate targets.
We have the financial resources…
| Money Available | Assets under Management |
|---|---|
| Sovereign Wealth Funds | USD 8 trillion |
| Insurance Funds | USD 33 trillion |
| Global Pension Funds | USD 53 trillion |
| Wealth of Top 1% of Global Adults | USD 173 trillion |
| Total of the above | USD 267 trillion |
| 1% Allocation to investments in the #SaveMyWorld Bucket | USD 2.7 trillion |
These are investments, not charity or grants
How YOUR money is invested by a typical Pension Fund;
Typical Investment Bucket
#SaveMyWorld

Only when the last tree has died And the last river been poisoned And the last fish been caught Will we realise we cannot eat money - Native American Cree tribe proverb
Disclaimer - Terms of Use
- Quantum Advisors Private Limited (QAS) is registered in India and holds a Portfolio Management License from Securities and Exchange Board of India (SEBI), India. It is also registered with the Securities Exchange Commission, USA as an Investment Adviser and a Restricted Portfolio Manager with the Canadian Provinces of British Columbia (BCSC), Ontario (OSC), and Quebec (AMF). It is not registered with any other regulator. This summary is subject to a more complete description and does not contain all of the information necessary to make an investment decision, including, but not limited to, the risks, fee and investment strategies of QAS
- Our past performance is no guarantee of future performance and QAS does not wish to convey any notion of guaranteeing returns in the future.
- Investing in shares or any asset is a risky proposition and share prices or prices of any assets can increase or decrease in value.
- Investors wishing to ‘double their money’ in one year or having short-term return objectives should not seek the advice of QAS as the research and investment style followed by QAS typically considers a longer-term time horizon.
- This is not an offer to raise or solicit an investment and should not be considered as such. It is merely a description of the business
- Q India Value Equity Composite is an aggregation of Client portfolios with a similar investment mandate and with no cash restrictions that are managed or advised by Quantum Advisors on a discretionary basis using the long only public equity strategy. The Composite does not include all client portfolios due to various client-imposed portfolio restrictions, even though all portfolios in this broad mandate are managed using the same strategy.
- The various constituents of the Composite pay different management fees. The net-of-fee and expense returns of the Q India Composite indicated in tables in this presentation reflect the weighted average management fees paid to Quantum Advisors Pvt Ltd (QAPL) by the different constituents of the Composite. The Composite represents 1.8% of the total AUM in the broad equity mandate of QAPL as on June 30, 2021.
- As the different constituents of the Composite are subject to different management fee structures, the actual performance experienced by a constituent of the Composite may be worse or better than the net-of-fee-and-expense returns of the Composite.
- The returns shown in the performance tables for CY 2011 to CY 2015 do not capture the impact of management fees paid by constituents of the Composite who pay such fees to QAPL from outside their portfolio accounts. From January 2016 onwards, the performance returns of the Composite is calculated net of management fees payable to QAPL whether or not the management fees are paid by the constituents from within or outside their portfolio account.
- Till December 2015, performance returns of certain constituents of the Composite were computed on a pre-tax basis while the returns of remaining constituents were computed on a post-tax basis. For the months of January and February 2016 the returns of all the constituents were computed on a post-tax basis, where tax was paid out of the Client’s portfolio account. Effective March 2016, in order to bring the performance calculation practice in line with market practice, all return numbers have been computed on a pre-tax basis.
- The net-of-fee and expense returns for CY 2006 to CY 2015 have been computed after adjusting the management fees received by QAPL from the constituents’ portfolio accounts on a receipt basis – generally at calendar quarter intervals and have not been calculated on an accrual basis. Starting January 2016, the performance returns are calculated net of management fees payable to QAPL and are being accrued on a monthly basis.
- Till December 2015, the capital gain taxes (if any) paid by some of the constituents of the Composite were not considered while reporting performance numbers. Starting January 2016, the performance returns are being calculated after reducing capital gain taxes (if any) paid by all constituents of the Composite, for which payment of capital gain taxes are made from their respective portfolio account.
- S&P BSE MID CAP & S&P BSE SMALL CAP (Old indices) were replaced by S&P BSE Midcap & S&P BSE SmallCap (New indices) effective 16 April 2015. The old indices ceased to exist with effect from 16 April 2015. Both the new indices are coming out of S&P BSE AllCap and hence indices are based on altogether different methodologies and have different constituents. The history of the old indices is different from that of the new indices. Both the new indices have 10 years of history (S&P BSE Midcap & S&P BSE SmallCap). The first value date for these indices is 16 September 2005.
- The "Index" is a product of Asia Index Private Limited, which is a joint venture of S&P Dow Jones Indices LLC or its affiliates (“SPDJI”) and BSE, and has been licensed for use by QAPL. Standard & Poor’s® and S&P® are registered trademarks of Standard & Poor’s Financial Services LLC (“S&P”); BSE® is a registered trademark of BSE Limited (“BSE”); and Dow Jones® is a registered trademark of Dow Jones Trademark Holdings LLC (“Dow Jones”). © Asia Index Private Limited 2014. All rights reserved. Redistribution, reproduction and/or photocopying in whole or in part are prohibited without written permission of AIPL. For more information on any of AIPL’s indices please visit http://www.asiaindex.com/. None of AIPL, BSE, Dow Jones Trademark Holdings LLC, their affiliates nor their third party licensors make any representation or warranty, express or implied, as to the ability of any index to accurately represent the asset class or market sector that it purports to represent and none of AIPL, BSE, S&P Dow Jones Indices LLC, Dow Jones Trademark Holdings LLC or their affiliates nor their third party licensors shall have any liability for any errors, omissions, or interruptions of any index or the data included therein.
- The capacity has been calculated based on the assumptions that (a) we can replicate 96% of our existing portfolio; (b) at different levels of AuM, different percentage levels of the existing portfolio can be replicated; (c) QAPL’s group exposure across all its institutional clients in a stock is limited to 10% of the outstanding capital of a company; and (d) all clients redeem their capital on the same day. *AUM figure includes AUM of the total clients (including SMA’s) of QAPL and its Mauritius based affiliate, QIEF Management LLC, to whom QAPL provides investment advisory service.
- S&P BSE 200 is a free-float-adjusted, market-cap-weighted index of 200 companies listed on the Bombay Stock Exchange.
- As of 1 January 2008, the benchmark for the Composite strategy was changed from the BSE 30 to the BSE 200. Since the investment universe is the companies constituting the BSE 200 Index or any appropriate additions made to it, the firm believes that the BSE 200 is a more appropriate benchmark and reflects a realistic comparison with portfolio performance. Hence we believe that BSE 200 is more representative of the investment strategy since it includes most of the stocks in which the portfolio may invest.
- Given that the BSE 200 comprises large cap stocks which are highly liquid, we believe it makes a good benchmark as the Composite’s portfolio has a bias towards highly liquid stocks. However, the Composite’s performance may not be strictly comparable with the performance of the Benchmark, due to inherent differences in the construction of the portfolios, and the volatility of the benchmark over any period may be materially different than that of the composite over the same period.
- The firm sources benchmark-related data from Bloomberg. When the benchmark was changed on 1 January 2008, the Total Return Index values for S&P BSE 200 were not available on Bloomberg. Subsequently, Bloomberg began publishing index values for the S&P BSE 200 Total Return Index in February 2014. As the Total Return values are available now, the firm believes it to be the best practice to report the total return of the benchmark instead of the price returns.
- Data of other indices is provided for information purposes only and to allow investors to compare the performance of the Composite to that of certain indices (many of which are well known and widely recognized). While we generally believe these comparisons provide meaningful and useful information to investors (for example, as a way of comparing an investment in the Composite to other types of investments that investors might make), inclusion of any particular index is not a representation that the index is an appropriate benchmark for evaluating the Composite’s performance. In particular, the volatility of indices over any period may be materially different from that of the Composite over that same period.
- Up to December 2007, the benchmark for the Composite was the BSE 30 Total Return Index (TRI). Starting in January 2008, the benchmark was changed to the BSE 200. We have continued to provide return numbers for the BSE 30 TRI post-December 2007 for information purposes only, and to allow investors to compare performance of the Composite to the same.
- The stocks/securities discussed in this presentation have been featured purely for illustration purposes. This is not a recommendation to buy or sell these stocks. There is no assurance that the stocks discussed herein will form part of Client portfolios. The stocks described above may not represent all the stocks purchased, sold or recommended or to be purchased, sold or recommended for clients and the reader should not assume that investments in the stocks discussed above will be profitable.
- ‘AUM in broad equity mandate’ includes the assets under management (AUM) of all client accounts managed and advised by QAPL as well as the Quantum Long Term Equity Fund and the Quantum Tax Saving Fund, the local mutual fund schemes managed by Quantum Asset Management Company Private Limited, a wholly owned subsidiary of QAPL.
- This presentation report is strictly for information purposes. Investments in the Account are not guaranteed or insured and are subject to investment risks, including the possible loss of the principal amount invested. The value of the Account and the income from it may fall as well as rise. Past performance is not necessarily indicative of future performance. QAPL reserves the right to make any changes and corrections to its opinions expressed in this document at any time, without notice. Information sourced from third parties cannot be guaranteed and has not been independently verified. Comments made herein are not necessarily indicative of future or likely performance of the Account and are based on information and developments as on November 30, 2018 unless otherwise stated.
- All of the forward-looking statements made in this communication are inherently uncertain and QAPL cannot assure the reader that the results or developments anticipated by QAPL will be realized or even if realized, will have the expected consequences to or effects on, us or our business prospects, financial condition or results of operations. A prospective investor can generally identify forward-looking statements as statements containing the words “will”, “should”, “can”, “may”, “believe”, “expect”, “anticipate”, “intend”, “contemplate”, “estimate”, “assume”, “target”, “targeted” or other similar expressions. Readers are cautioned not to place undue reliance on these forward-looking statements in making any investment decision. Forward-looking statements made in this communication apply only as of the date of this communication. While we may elect to update forward-looking statements from time to time, we specifically disclaim any obligation to do so, even if internal estimates change, unless otherwise required by applicable Securities laws.
Our Strategies
Explore how our two main strategies – Predictable India Equity and India Integrity Equity - with demonstrated success of our tried and tested research and investment processes can ensure your India equity allocation will have higher predictable outcomes and no surprises.
Q India Value Equity Strategy
20+ years of India Long-only, Liquid, High-Governance, Margin of safety = Predictability
Integrity screen since 1996, strategy Track record since 2000.
Q India Responsible Returns Strategy
Liquid, proprietary Integrity Scores, Financial Soundness
Integrity Screen since 1996, enhanced criterion since 2015, strategy Track Record since 2019; strategy AuM: $9.7 mn Mandate Capacity: $5 billion
Quantum Advisors pioneered a quantitative as well as qualitative analytical approach to equity investing in India, providing for the first time, consistently applied valuation metrics to evaluate investment opportunities in India’s emerging stock markets. Over the years, Quantum Advisors has continued and enhanced its tradition of extensive financial analysis and value investing, as it has evolved into an investment advisor and asset manager.
Our investment philosophy and strategy involves the use of intensive qualitative and quantitative fundamental analysis. We build and monitor our clients’ portfolios actively while at the same time avoiding excessive trading, and control risk by endeavoring to keep our clients’ portfolio adequately diversified, both in terms of the sectors included in those portfolios, as well as with respect to the level of concentration in any specific security.