


On 17th May, 2004, the Indian stock markets hit its lower circuit, (-20%). The Bombay Stock Exchange (BSE)-30 Index, Sensex, fell by 842 points, its steepest one-day fall ever then.
The National Democratic Alliance (NDA) led by Bharatiya Janata Party ( BJP) lost the general election to the United Progressive Alliance (UPA) led by India’s GOP, the Indian National Congress (INC). That the UPA alliance was supported by the Left/communist parties seemed to have spooked the markets in believing that the reform momentum will end and India’s growth trajectory which was recovering would be stalled.
I joined Quantum in August 2004 and my boss and Quantum’s founder, Ajit Dayal guided me to write my first research piece titled ‘Government Actioned Politics’ – The Quantum GAP report. A simple analysis to show:
- The reform process initiated in India since 1980 had led to a sustained rise and break-out of the Indian GDP growth;
- Between 1980 and 2004, the Indian government at the Centre/Federal level had changed 7 times
- 4 of those 7 governments were Coalition governments, Governments with no clear party with majority;
- Coalition governments may be slow, may bicker, but can create consensus to drive decisions;
- There were governments with a tilt to the left; there were governments with a tilt to the right; and they all continued the reform momentum;
- The average Real GDP growth across those 7 governments was 5.8%; The BSE-30 Sensex Index in USD terms from 1980 till May 2004 delivered a CAGR of 5.8%; INR CAGR 16.3%
- Indian GDP and Indian stock markets are correlated. However, governments in power have no correlation to long-term GDP growth and long-term stock market returns.
Our message to potential clients based on this thesis then was ‘Buy India’.
Indian corporates are used to this loud, messy, chaotic democracy which throws up unpredictable outcomes. The market correction was a great opportunity to build/allocate to your long-term India allocation.
Extend the same simple analysis to today:
- Between 1980 and 2023, the Indian government at the Centre/Federal level has changed 11 times;
- 8 of those 11 governments are Coalition governments; However, both the Governments since 2014 have had BJP winning clear majority on its own. So although it’s a coalition, it acts like a single party government;
- The average Real GDP growth across those 11 governments has now increased to 6.2%; The BSE-30 Sensex Index in USD terms from 1980 till August 2023 has delivered a CAGR of 9.5%; INR CAGR 15.5%.
If now, pre and post the 2024 elections, if the Indian stock markets correct, only because of a change in government, you know what to do.
Chart 1: Indian governments, across parties, have followed a steady set blueprint of reforms since 1980 boosting long-term GDP growth
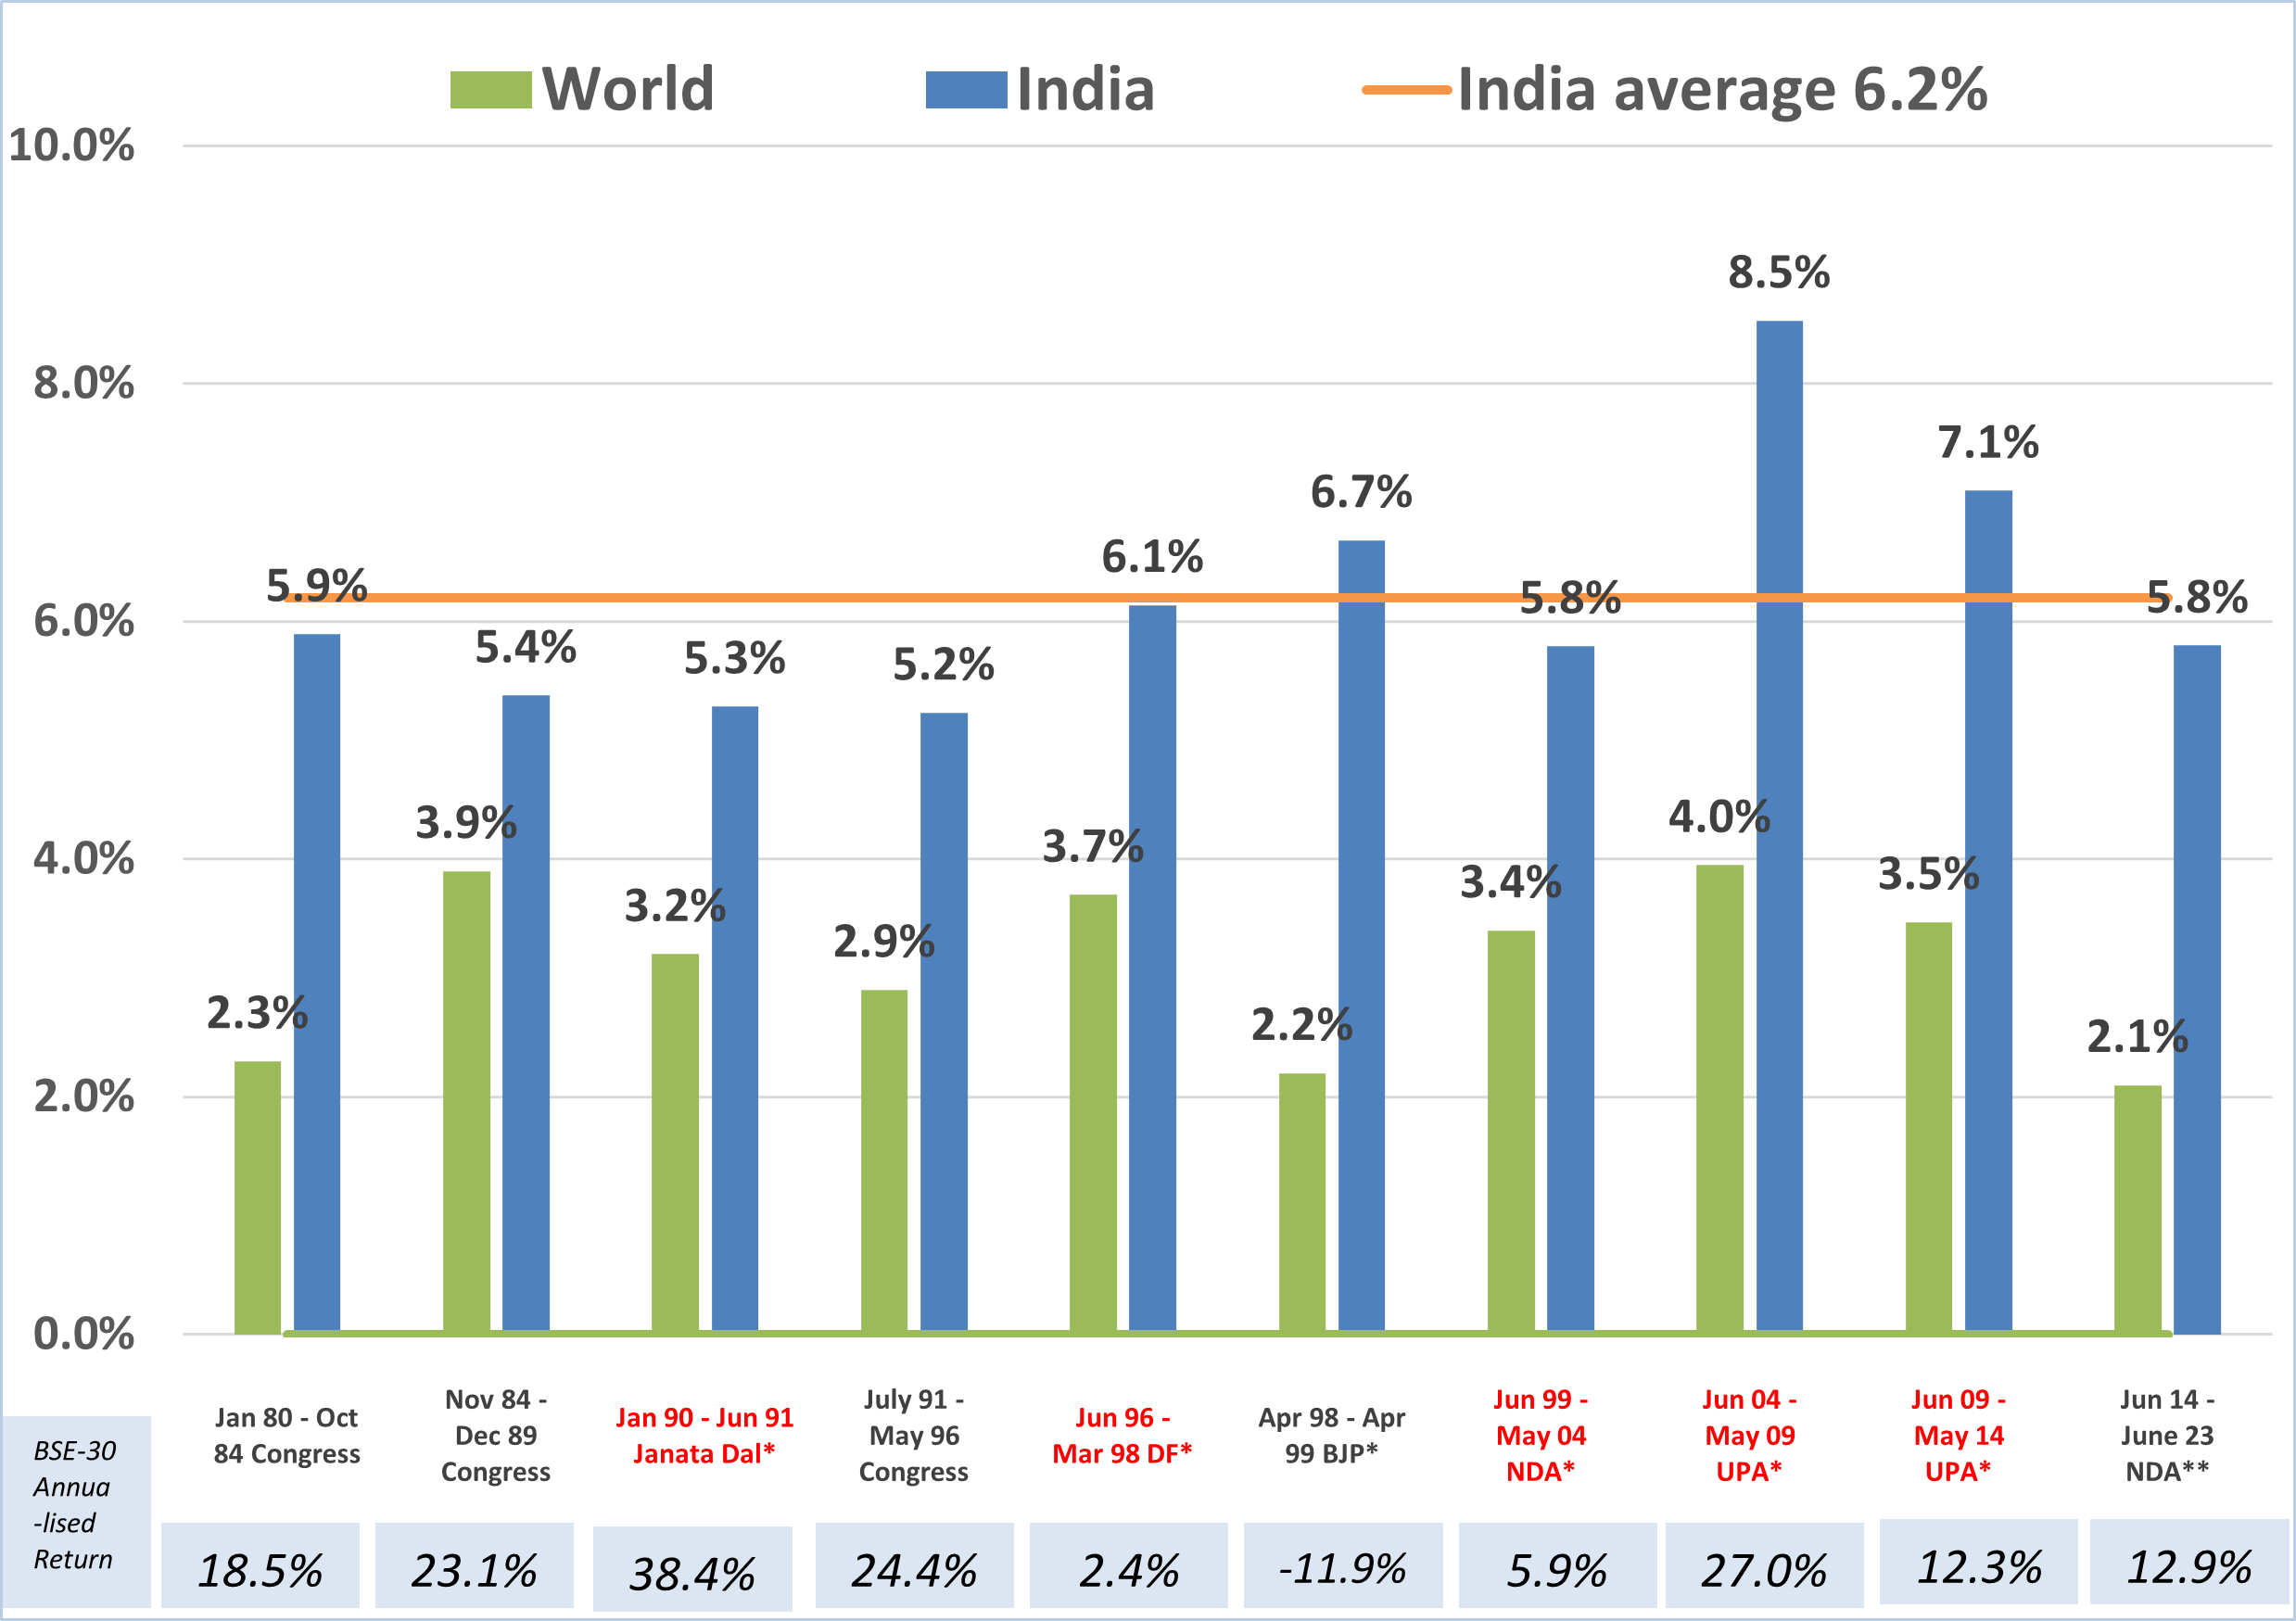
Source: loksabha.nic.in; World Bank; parties in red – coalition governments; in black – single party majorities; World GDP post 2020 is annual; 2023 GDP is estimate; India GDP uses old and new GDP series; Returns are for BSE-30 Index; From April 1998 is Total Returns Index in INR as sourced from Bloomberg Finance L.P; Analysis by Quantum Advisors
The next general elections (federal elections) are scheduled to be held in April-May 2024. What has got the market talking about it already is due to a renewed strategy of the opposition parties to counter the two-term incumbent Modi government of BJP.
BJP is the only party since 1984 to have won two successive elections with a simple majority of its own. Fearing a repeat, given Modi’s popularity and their general handling of the economy, the opposition parties have strung together an alliance of 28 parties, hoping to put forward a united challenge to Modi and BJP.
The opposition seems to have rattled the BJP by calling their alliance INDIA (Indian National Developmental and Inclusive Alliance). So much so that, the government has started referring itself as ‘BHARAT’ in official communique.
These probable outcomes have got the sell-side strategists excited. Morgan Stanley and Jefferies have come out with long reports analysing possible scenarios and likely outcomes.
Jefferies gives a 10% probability to a BJP defeat in 2024 and expects markets to correct by 10%. Morgan Stanley thinks markets would correct 20%-25% if the INDIA alliance wins and a 40% drop in a scenario of neither lead party getting 200 seats leading to a weaker coalition government in the Centre.
| Period | Previous Govt led by | New Govt led by | Market Returns around elections | Annualized Returns during the entire term of government | ||
|---|---|---|---|---|---|---|
| 3 months pre | 3 months post | INR | USD | |||
| July 1991 – May 1996 | Janta Dal* | Congress | 7% | 44% | 24.4% | 12.2% |
| Jun 1996 – Mar 1998 | Congress | United Front* | 6% | -5% | 2.4% | -4.0% |
| Apr 1998 – Apr 1999 | United Front* | BJP* | 7% | -8% | -11.9% | -18.2% |
| Jun 1999 – May 2004 | BJP* | BJP* | 9% | 6% | 5.9% | 4.7% |
| June 2004 – May 2009 | BJP* | Congress* | -10% | -2% | 27.0% | 26.1% |
| June 2009 – May 2014 | Congress* | Congress* | 26% | 27% | 12.3% | 7.3% |
| June 2014 – May 2019 | Congress* | BJP | 17% | 8% | 11.9% | 8.4% |
| June 2019 – Aug 2023 | BJP | BJP | 9% | -5% | 13.7% | 9.1% |
(Source: morganstanley research report for market returns 3 month pre and post elections; BSE-Sensex data; Quantum Advisors analysis for govermment and market period returns; *-lead party without majority; returns are for BSE-30 Sensex; returns from April 1998 are total returns as sourced from Bloomberg Finance L.P)
Long-term investors don’t need to bother about it.
The reason it does not seem to matter at all is that:
- Successive governments carry on the reform process and hence attract long-term capital
- Governments share of the economy isn’t that large
- Indian economy is driven more by individuals and private enterprise and is linked to the global economy to a larger extent than apparent
- Indian corporates are well placed to deal with the chaos of the political system
Since 1980, India has in general pursued a blue print which facilitates the following:
- Moving to a market driven economy;
- De-regulate, liberalise and privatise various segments of the economy;
- Creating Rule of Law with institutions which allow markets to function; businesses to survive; and competition to thrive
Some governments may focus on the hard aspects facilitating the above ; some governments may choose to prioritise the softer reforms required to improve productivity. Some governments may be populist; some may be fiscal conservatives. Some may build consensus; some may take majoritarian decisions.
The BJP/NDA overs its terms delivered some hard reforms in enacting power reforms; easing FDI; fiscal responsibility; inflation targeting; bankruptcy act; and also delivered on softer issues with its household welfare (toilets, gas, electricity, water); financial inclusion and digital transformation. It made blunders with demonetisation and its policies has resulted in depressed farm and rural incomes.
The Congress/ UPA drove private investment in infrastructure, eased FDI and enabled a rights based reforms in delivering food, rural employment, information, education, information and identity(Aadhar). It made a mess of managing macro stability and was riddled with corruption charges.
There is merit in strong, stable governments, to take decisions and implement at a faster pace. But strong governments often lack parliamentary accountability. They can also take damaging decisions like nationalisation, emergency, demonetisation, which can have adverse consequences.
What investors need is certainty. Which comes from political stability. Since 1999, all governments, be it single majority or coalition, have completed their full term of 5 years.
For a diverse country like India, with Federal, state and municipal government system, a coalition government seems imperative to build consensus and drive decisions. Some of the best reforms have happened under coalition governments. It is not a constraint to reform, because government’s find ways to compromise and build consensus.
This aspect of India being a democracy in a diverse society and with the pressures of coalition politics, is also why India is not China and there are limits to India’s potential growth.
We continue to believe that India’s long term real GDP growth potential is 6.0%-6.5%. This leads to an annual nominal GDP growth of around 11%-12%. That nominal growth plus corporate productivity is what is reflected in the Indian equity markets and its indices.
This double digit nominal returns is the long-term equity return assumption case for the last three decades and will remain possible for the coming two decades.
That GDP across government chart you saw above, is thus A simple message to think about potential growth and returns from India, long-term.
Our Strategies
Explore how our two main strategies – Predictable India Equity and India Integrity Equity - with demonstrated success of our tried and tested research and investment processes can ensure your India equity allocation will have higher predictable outcomes and no surprises.
Q India Value Equity Strategy
20+ years of India Long-only, Liquid, High-Governance, Margin of safety = Predictability
Integrity screen since 1996, strategy Track record since 2000.
Q India Responsible Returns Strategy
Liquid, proprietary Integrity Scores, Financial Soundness
Integrity Screen since 1996, enhanced criterion since 2015, strategy Track Record since 2019; strategy AuM: $9.7 mn Mandate Capacity: $5 billion
Quantum Advisors pioneered a quantitative as well as qualitative analytical approach to equity investing in India, providing for the first time, consistently applied valuation metrics to evaluate investment opportunities in India’s emerging stock markets. Over the years, Quantum Advisors has continued and enhanced its tradition of extensive financial analysis and value investing, as it has evolved into an investment advisor and asset manager.
Our investment philosophy and strategy involves the use of intensive qualitative and quantitative fundamental analysis. We build and monitor our clients’ portfolios actively while at the same time avoiding excessive trading, and control risk by endeavoring to keep our clients’ portfolio adequately diversified, both in terms of the sectors included in those portfolios, as well as with respect to the level of concentration in any specific security.